How Often Do Prop Firms Pay Out? Data From 17 Months
Across 1,500 simulated prop-account lifecycles — built on 12 months of empirical trading data and verified against 4 live months since — the median outcome is 2 payouts per month, with the first payout arriving after 41 days, and the account surviving in 100% of simulated paths. Those are Puravida Edge’s published figures for its top forex portfolio on a 100K account; this article breaks down where they come from and what moves them. The gates, split and cadence of all 40 firms are on prop firm payout rules compared.
Watch page with full transcript →
The full breakdown from this article, as a 4-minute film: every number below, on screen, in order.
Two different questions hide inside “how often do prop firms pay out,” and mixing them up is why most answers online are useless.
The first question is about the firm’s payout policy — how frequently the firm lets you request money. That’s a rulebook fact and it varies by firm and account type; always check the current terms of the firm you’re evaluating, because payout cycles change more often than any other rule.
The second question is the one that actually determines your income: how often does your strategy earn a payout you’re allowed to take? That depends on your edge, your sizing, the drawdown model, and the buffer you keep above the floor. It’s measurable — and that’s the question this article answers with data.
What does “payout frequency” actually depend on?
Four variables, in order of impact:
| Variable | Why it moves payout frequency |
|---|---|
| Net expectancy per month | No expectancy, no payouts — everything else is secondary |
| Drawdown model of the account | Determines how much buffer a losing streak burns before you can withdraw |
| Buffer policy after each payout | Every withdrawal moves you closer to the floor; withdraw too aggressively and one normal streak ends the account |
| Consistency and minimum-day rules | Can delay an earned payout even when the money is already there |
The interaction between the second and third row is the part traders underestimate. A strategy that earns steadily but withdraws everything each cycle spends its whole life a few losing trades from the floor. That mechanic — not weak strategies — is why the day after a payout is statistically the riskiest day an account has.
How often does a systematic strategy actually earn payouts?
Here is the full dataset for one portfolio, published and refreshed monthly: Forex Champion — four of our nine strategies (Hook and Anchor on the Nasdaq, Reject and Trace on gold) combined on a 100K swing account.
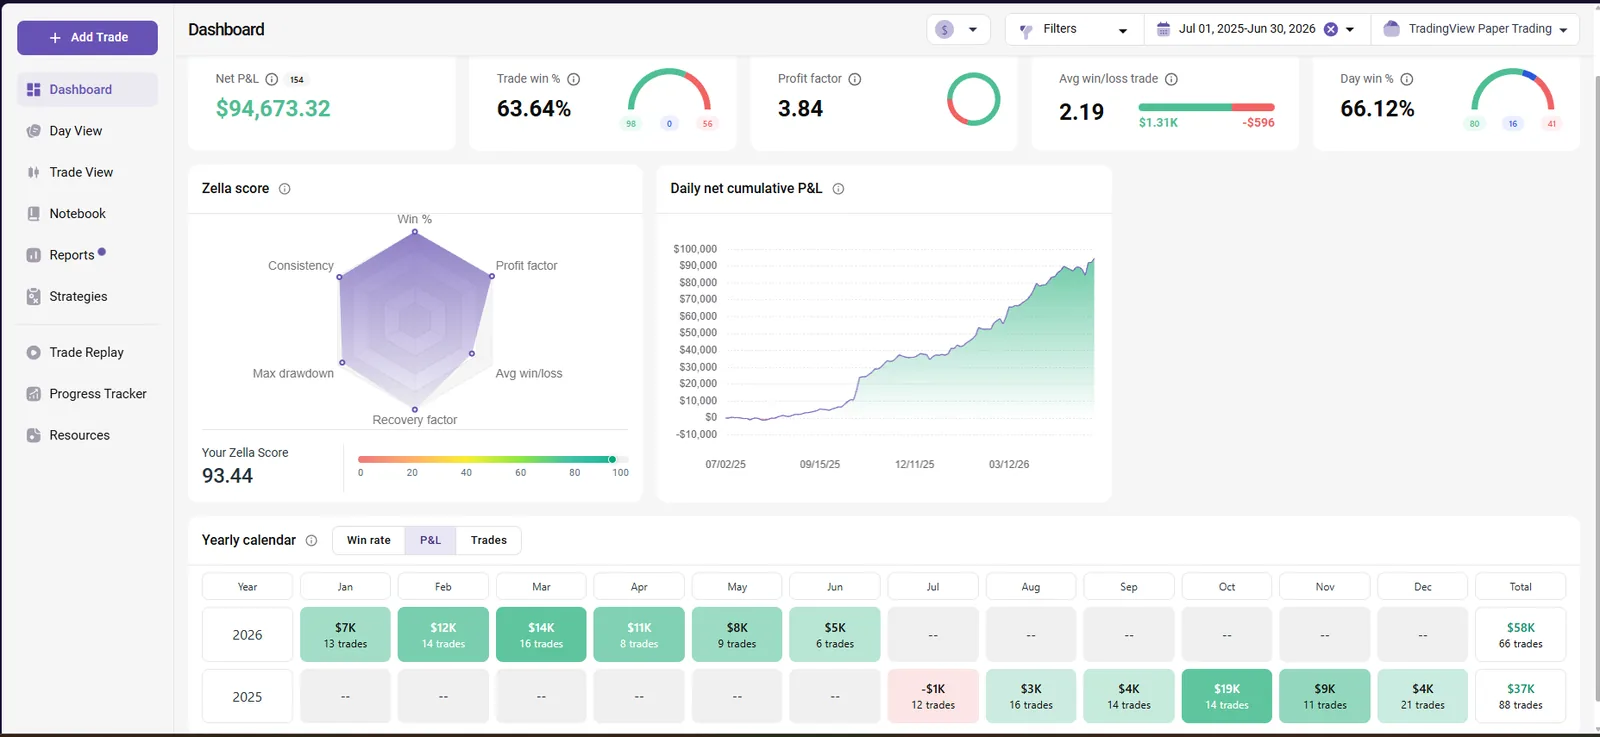
The empirical layer. Over the trailing twelve months (Jul 2025 – Jun 2026), with commission and slippage deducted on all 257 trades: net $92,794 on the 100K preset, trade win rate 71.6%, profit factor 3.59. The full tracked window is longer — sixteen months of daily P&L, April 2025 through July 2026 — and across all sixteen there is exactly one red month (July 2025, −$1,344) and a deepest drawdown of $5,245.
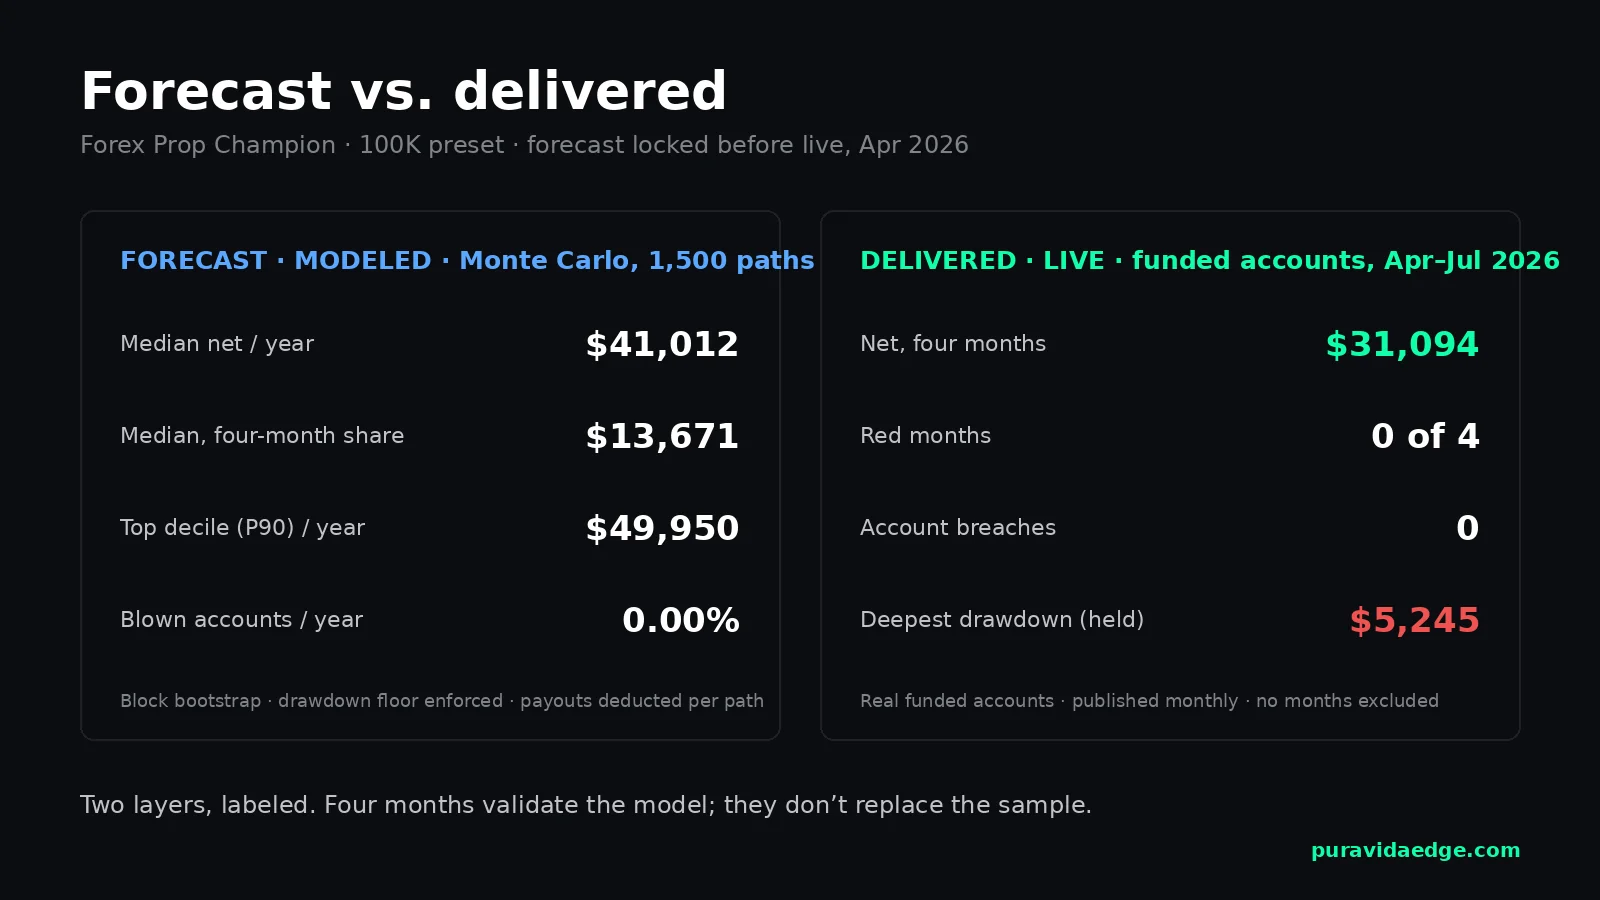
The modeled layer. The daily P&L resampled into 1,500 alternate account lifecycles (block bootstrap), each run through a full prop-account state machine: evaluation, funding, payouts deducted as they occur, the account’s drawdown floor enforced after every one — a deliberately strict assumption. Median result: 72 payouts across a 3-year horizon — two per month — with a median of 41 days to the first one and zero blown accounts in 1,500 paths.
The live layer. Since April 2026 the same portfolio runs on real funded accounts. Four months in: $31,094 net, zero breaches, zero red months — and the deepest drawdown of the entire sixteen-month window happened inside the live period. The account held through it. Live results are published next to the model every month.
Three layers, three labels. Any track record that doesn’t tell you which layer a number comes from isn’t a track record.
Why does the first payout take 41 days, not a week?
Because the clock includes everything the marketing version skips: the evaluation itself, the minimum trading days most firms require, and — most importantly — building enough buffer above the drawdown floor that the first withdrawal doesn’t leave the account one losing streak from termination. Paths that rushed the first payout show up in the simulation as the ones that die young.
41 days is the median for this portfolio’s profile. Configurations tuned for safety over speed run longer: across our twelve published portfolio configurations, futures and forex, typical time-to-first-payout ranges from 41 to 146 days. If a vendor quotes you “funded and paid in two weeks,” ask which of these variables they deleted. There’s a longer breakdown of realistic timelines in time to first prop payout.
What payout frequency should you plan around?
Plan around the median, survive the percentiles. For the portfolio above, the modeled annual net spans $32,284 (P10) to $49,950 (P90) around a $41,012 median — all three numbers published, because a single-number forecast is a sales pitch, not a model.
Practical planning rules that fall out of the data:
- Budget on P10, not the median. If the bottom decile still covers your evaluation and data costs, variance can’t force you out.
- Fix a buffer threshold before the first payout. Decide the dollar amount that stays above the floor no matter what, and withdraw only above it. Do the arithmetic against your own worst losing streak — a losing streak calculator makes that a five-minute exercise.
- Expect the drawdown during, not before. The deepest drawdown in our sixteen tracked months arrived in the live phase, after funding. Accounts sized for the average month die in the exceptional one.
The rule is the filter. The Playbook shows what fits through it.
Which configurations fit tight daily limits, trailing floors and consistency rules — sized to the drawdown, not the balance. One PDF, then our letters with what the systems did.
By email, from Puerto Viejo, Costa Rica. Unsubscribe anytime.
Related
- How often a systematic prop account actually pays out
- How to write trading strategy rules so they can be coded
- Inverted Fair Value Gap (iFVG): a systematic test
FAQ
How many payouts per year is realistic on a funded account?
For the systematic portfolio tracked above, the modeled median is 24 per year on a 100K forex account. The first four live months, reported separately, came in at or above what the model projected. Discretionary results vary too widely to state a defensible number.
How long until the first prop firm payout?
Median 41 days for the fastest of our published configurations; 41–146 days across all twelve. The range is driven by profile (safety vs speed), not by the firm's processing time.
Does withdrawing more often increase risk?
Yes, mechanically: every payout shrinks the buffer between the account and its drawdown floor. Frequent small withdrawals keep the account permanently close to the line; the trade-off is that money left inside remains at the firm's mercy.
Are these numbers guaranteed?
No. The modeled figures are Monte Carlo output — probability distributions, not promises — and the live sample is four months old. Both layers are published monthly precisely so the claim can be checked, in either direction.
Payout figures verified September 2026 against the published dataset (tracked window Apr 2025 – Aug 2026). Modeled and live results are labeled separately throughout. Past performance does not guarantee future results.