Gap
High-Selectivity
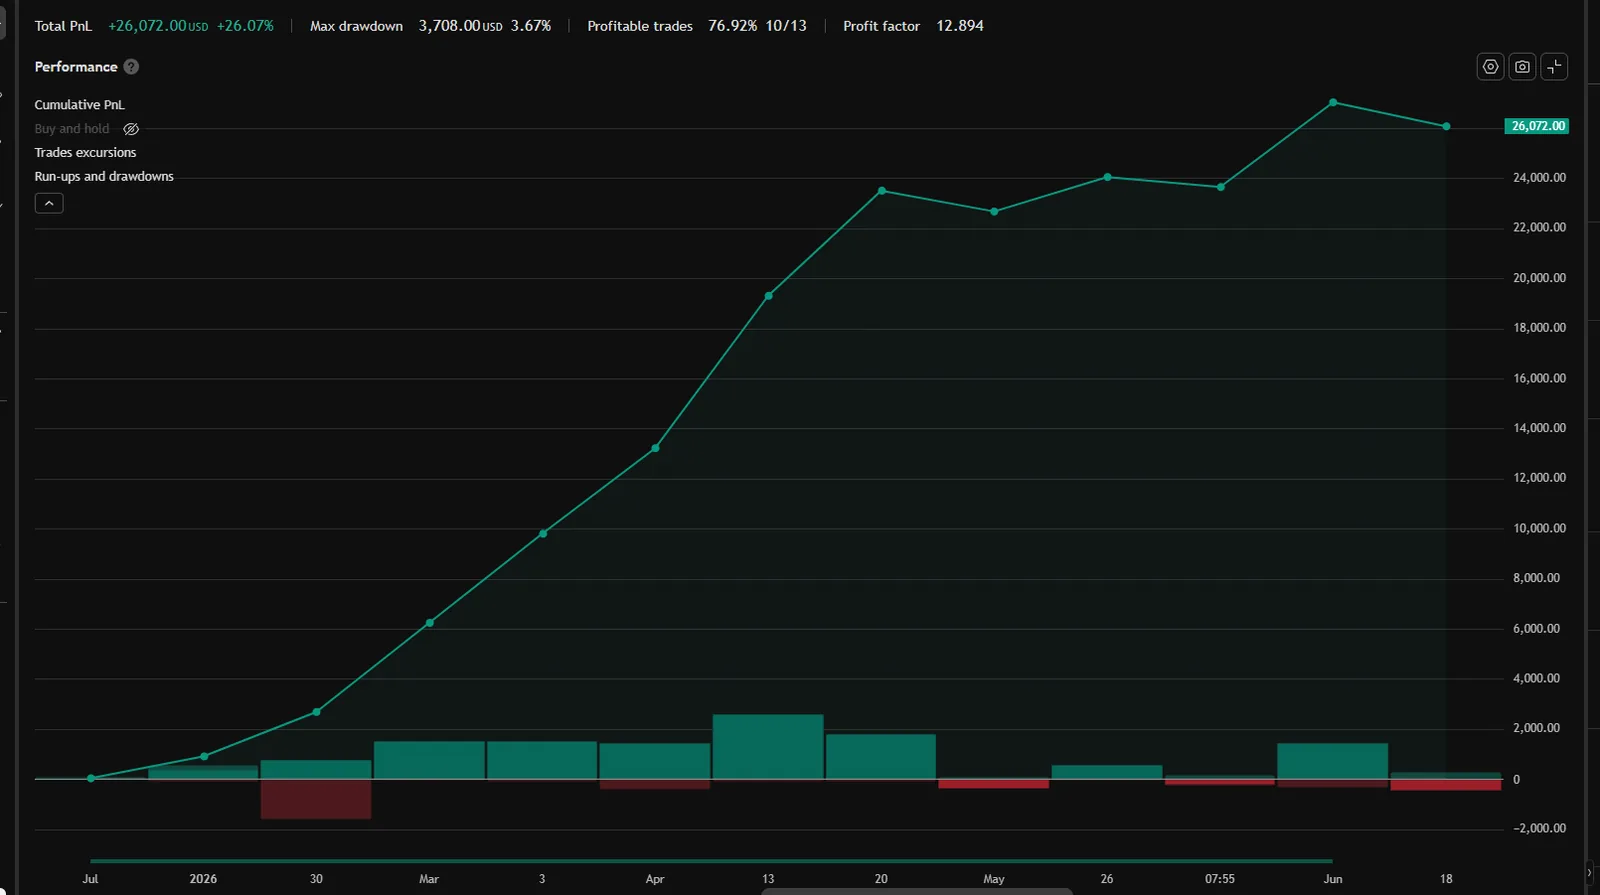
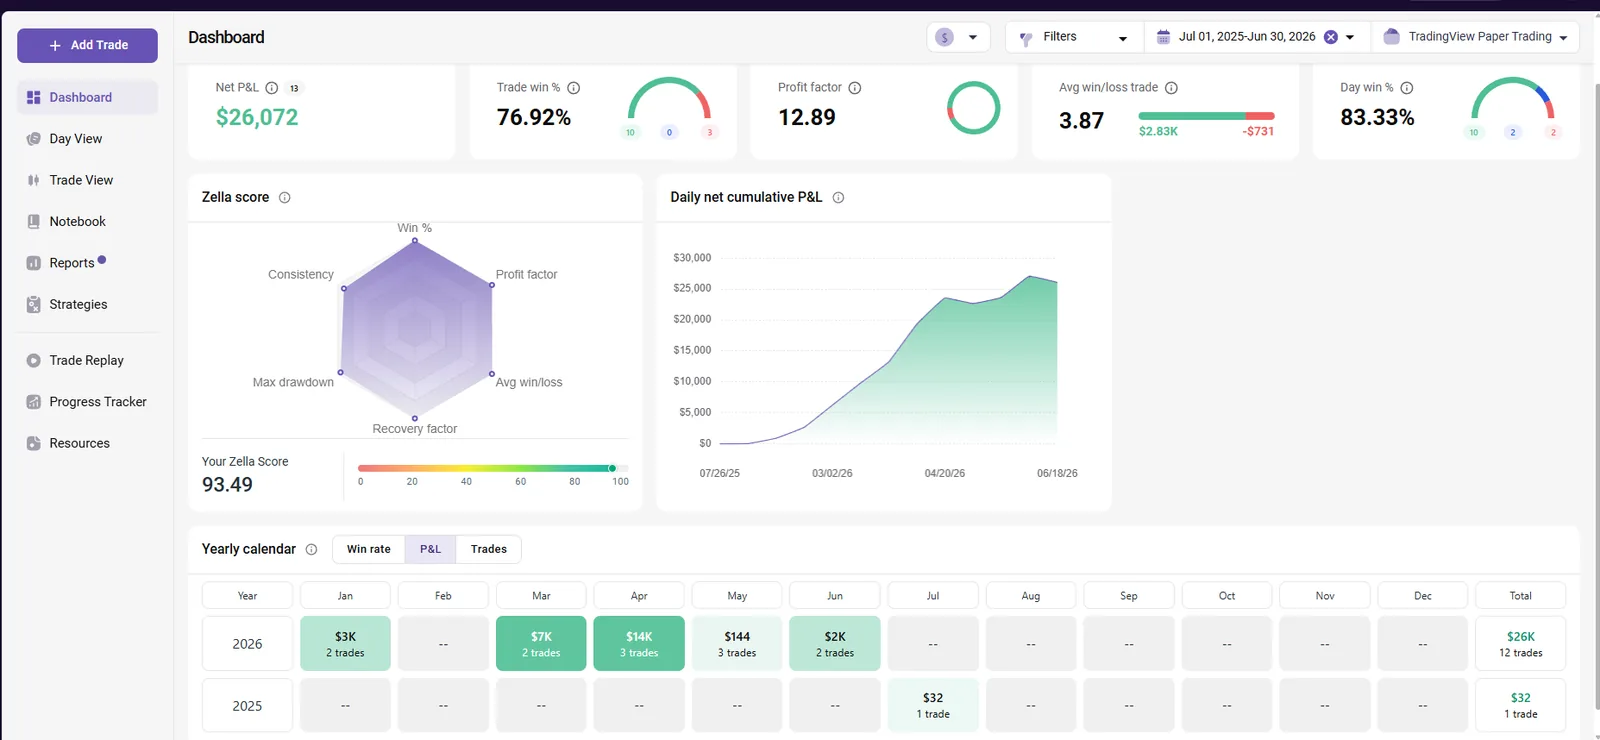
Trades the weekly gap between Friday close and Sunday open — gap-fill and gap-rejection setups. Low-frequency, high-conviction entries across MNQ, MGC, NAS and XAU. Rolling last 12 months (3 quarters pre-publication + Q2'26 live): averaging +$16.6k net per instrument, best PF 12.89 (MGC), ~0.5% modeled blow rate at 100K presets.
At a glance
Best-performing instrument per metric (max 3 from one instrument). Rolling last 12 months at 100K preset; forecast metrics from 1,500-path Monte Carlo, 3-year horizon. Viability 3y = % of MC paths that never hit the hard drawdown. Payouts : blow = payouts per one account blow over 3y. TTP = median days to first payout.
Equity curve · backtest + live
Daily P&L applied to the $100,000 starting balance at the 100K preset (8 ct), log scale. Gray = pre-publication (2025-04-01 → 2026-03-31); accent = live (2026-04-01 → 2026-06-30).
TradingView performance summary · last 4 quarters (Q3'25 — Q2'26)
Quarterly breakdown
| Quarter | Phase | Net | WR | Trades | Max DD (EOD) |
|---|---|---|---|---|---|
| Q3'25 | backtest | +$32 | 100.0% | 1 | $0 |
| Q4'25 | backtest | +$0 | 0.0% | 0 | $0 |
| Q1'26 | backtest | +$9,768 | 100.0% | 4 | $0 |
| Q2'26 live | live | +$16,272 | 62.5% | 8 | $960 |
Drawdowns are EOD basis; intrabar peak-to-trough runs higher.
Stats · backtest
| Avg win / loss | W:L | Largest win / loss | Max DD EOD | Sharpe | Sortino | Calmar | Avg bars |
|---|---|---|---|---|---|---|---|
| $1,960 / $442 | 4.43 | $3,560 / $616 | $1,768 (1.77%) | 1.43 (3.64 live) | 2.03 | 4.39 | 13.0 |
Account sizing · Monte Carlo 1,500 paths × 3y
| Account | Qty | Blow/y | Net/y P50 [P10–P90] | Median TTP | Status |
|---|---|---|---|---|---|
| 50K FP | 6 ct | 1.07% | $14,530 [$9,392–$20,093] | 52 d | SAFE |
| 100K FP | 8 ct | 0.11% | $19,472 [$12,991–$26,872] | 56 d | SAFE |
| 150K FP | 10 ct | 0.0% | $24,343 [$16,312–$33,590] | 57 d | SAFE |
Equity curve · backtest + live
Daily P&L applied to the $100,000 starting balance at the 100K preset (5 ct), log scale. Gray = pre-publication (2025-04-01 → 2026-03-31); accent = live (2026-04-01 → 2026-06-30).
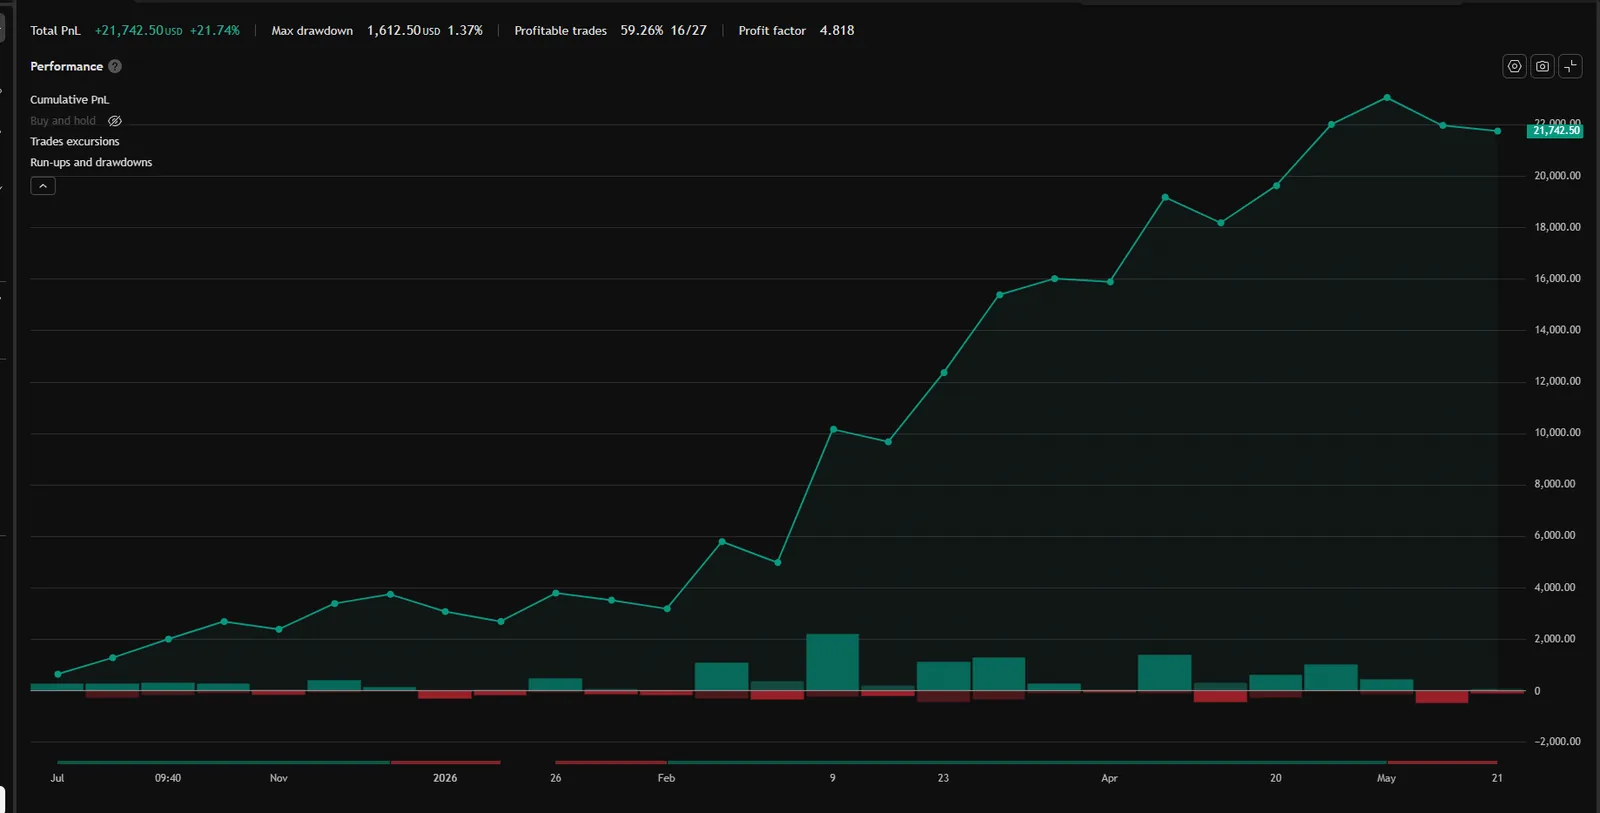
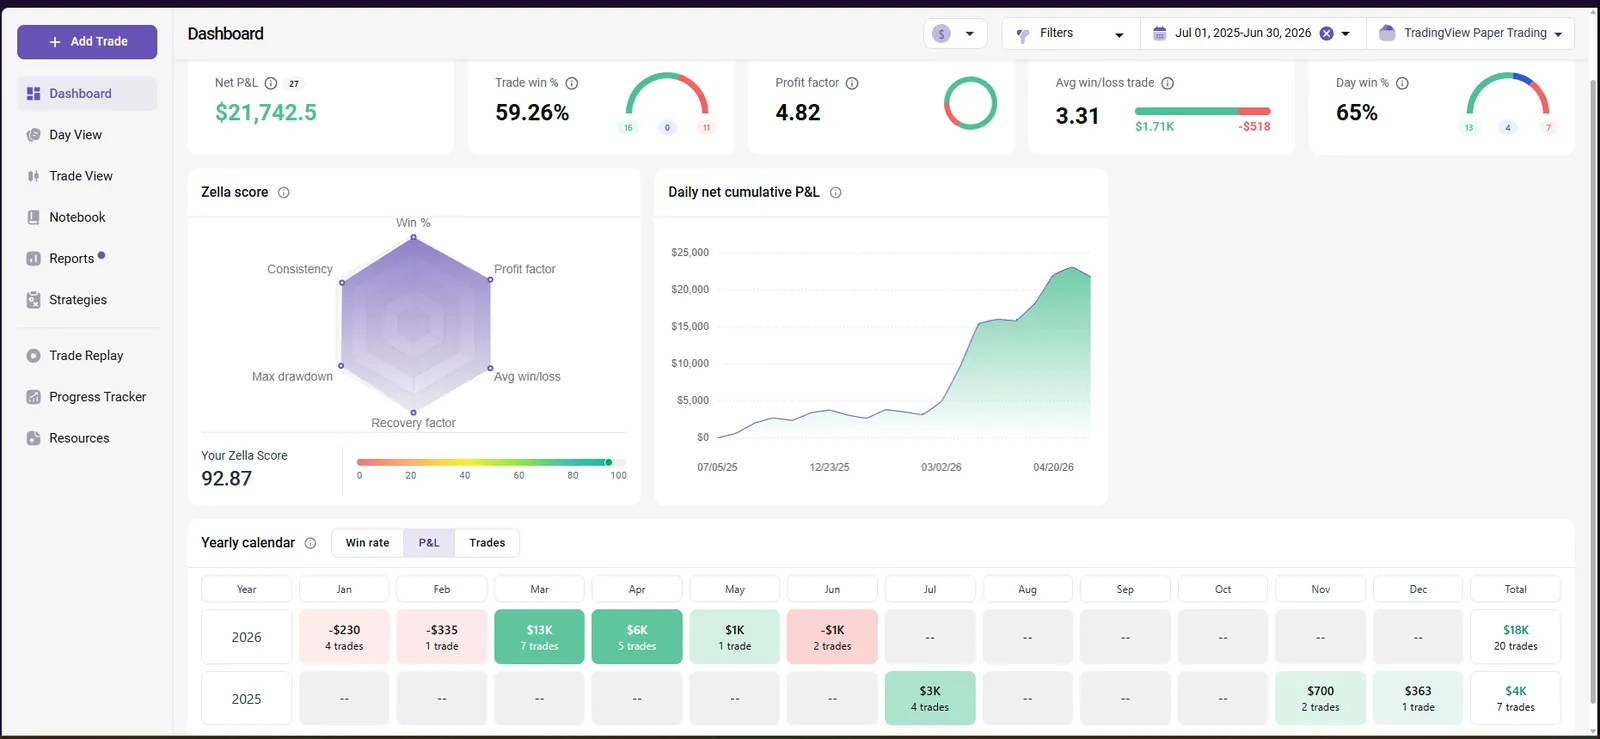
TradingView performance summary · last 4 quarters (Q3'25 — Q2'26)
Quarterly breakdown
| Quarter | Phase | Net | WR | Trades | Max DD (EOD) |
|---|---|---|---|---|---|
| Q3'25 | backtest | +$2,680 | 100.0% | 4 | $0 |
| Q4'25 | backtest | +$1,062 | 66.7% | 3 | $300 |
| Q1'26 | backtest | +$12,265 | 50.0% | 12 | $1,058 |
| Q2'26 live | live | +$5,735 | 50.0% | 8 | $1,305 |
Drawdowns are EOD basis; intrabar peak-to-trough runs higher.
Stats · backtest
| Avg win / loss | W:L | Largest win / loss | Max DD EOD | Sharpe | Sortino | Calmar | Avg bars |
|---|---|---|---|---|---|---|---|
| $1,854 / $547 | 3.39 | $6,728 / $1,050 | $2,060 (2.06%) | 2.05 (2.38 live) | 6.27 | 12.82 | 34.0 |
Account sizing · Monte Carlo 1,500 paths × 3y
| Account | Qty | Blow/y | Net/y P50 [P10–P90] | Median TTP | Status |
|---|---|---|---|---|---|
| 50K FP | 3 ct | 2.22% | $8,980 [$5,296–$12,691] | 75 d | SAFE |
| 100K FP | 5 ct | 3.58% | $14,856 [$8,005–$20,950] | 63 d | SAFE |
| 150K FP | 8 ct | 5.02% | $23,595 [$11,579–$33,361] | 58 d | CAUTION |
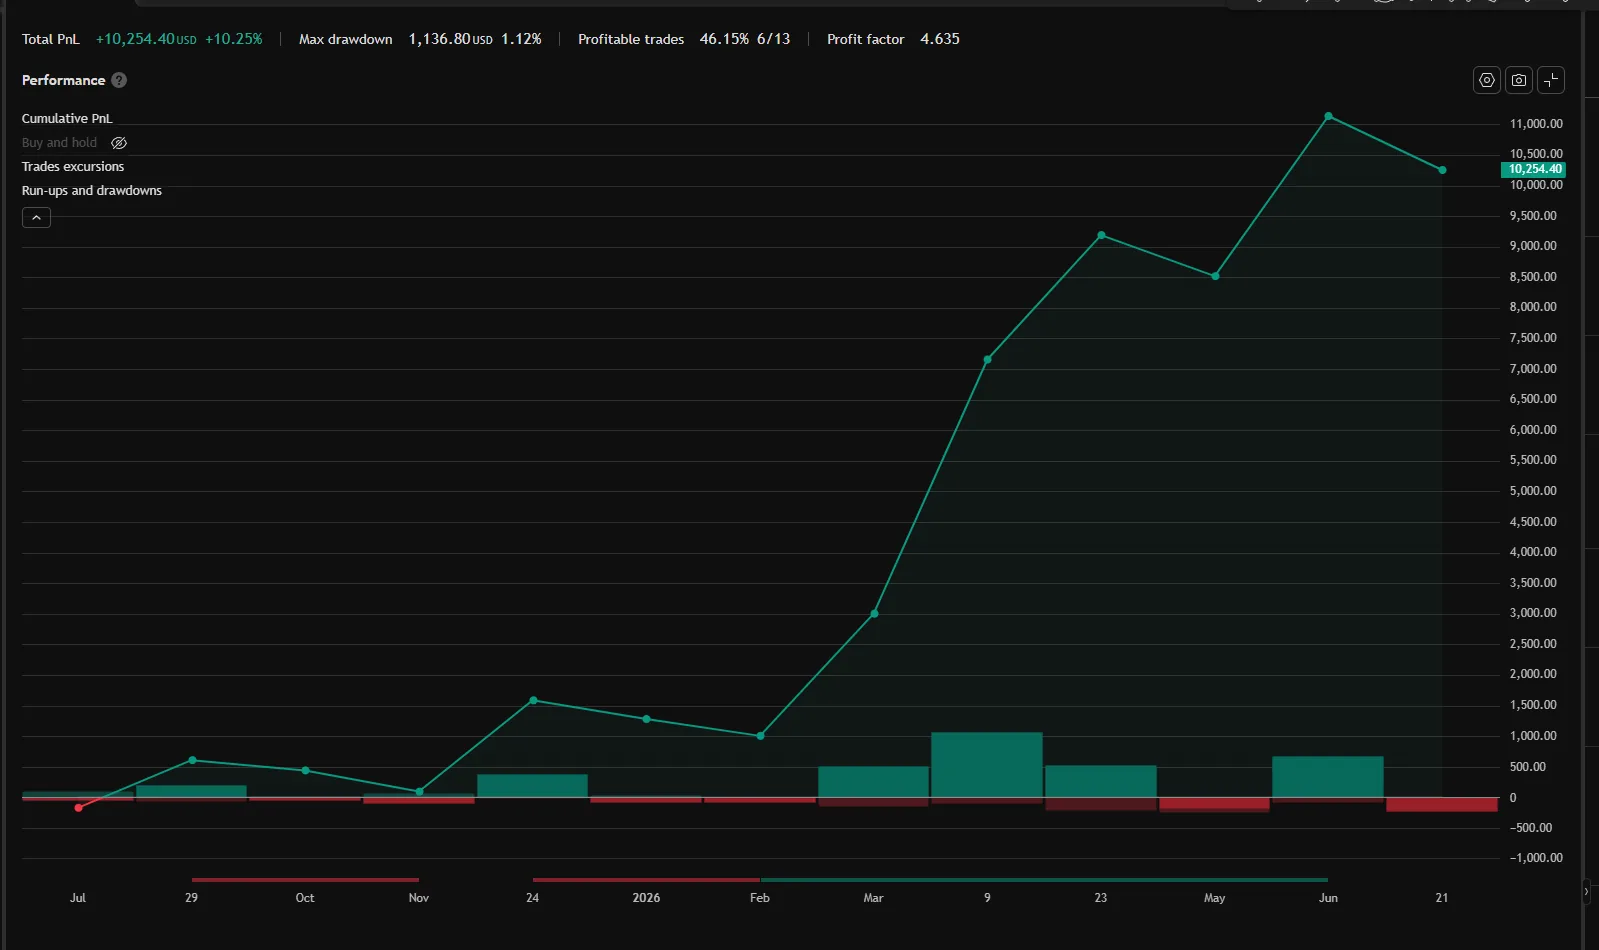
Equity curve · backtest + live
Daily P&L applied to the $100,000 starting balance at the 100K preset (8 lot), log scale. Gray = pre-publication (2025-04-01 → 2026-03-31); accent = live (2026-04-01 → 2026-06-30).
TradingView performance summary · last 4 quarters (Q3'25 — Q2'26)
Quarterly breakdown
| Quarter | Phase | Net | WR | Trades | Max DD (EOD) |
|---|---|---|---|---|---|
| Q3'25 | backtest | +$607 | 50.0% | 2 | $172 |
| Q4'25 | backtest | +$978 | 33.3% | 3 | $514 |
| Q1'26 | backtest | +$7,605 | 60.0% | 5 | $582 |
| Q2'26 live | live | +$1,064 | 33.3% | 3 | $882 |
Drawdowns are EOD basis; intrabar peak-to-trough runs higher.
Stats · backtest
| Avg win / loss | W:L | Largest win / loss | Max DD EOD | Sharpe | Sortino | Calmar | Avg bars |
|---|---|---|---|---|---|---|---|
| $2,599 / $299 | 8.68 | $5,250 / $529 | $701 (0.7%) | 2.05 (0.73 live) | 7.48 | 22.59 | 73.0 |
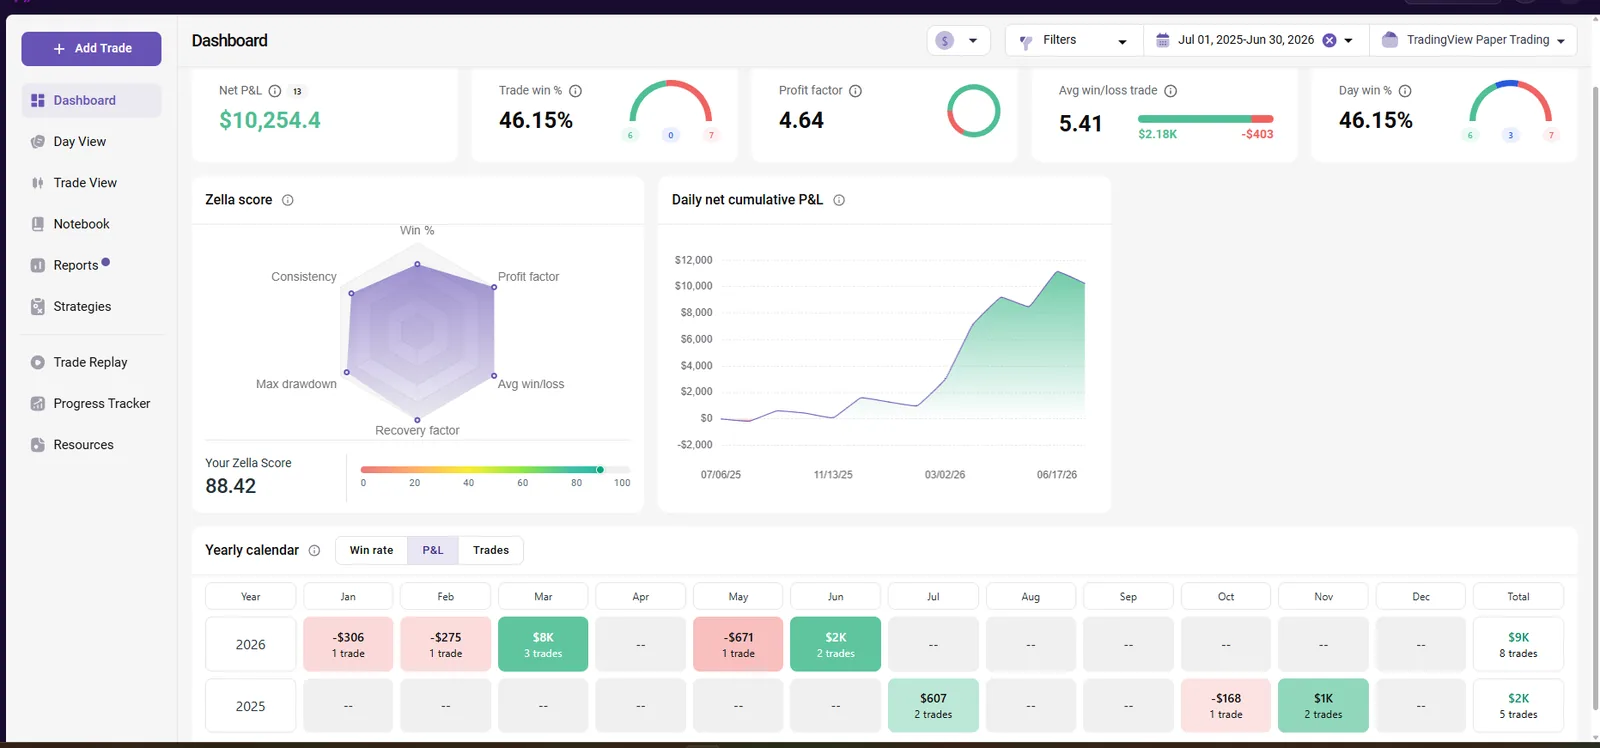
Account sizing · Monte Carlo 1,500 paths × 3y
| Account | Qty | Blow/y | Net/y P50 [P10–P90] | Median TTP | Status |
|---|---|---|---|---|---|
| 50K Swing | 4 lot | 0.13% | $3,916 [$2,197–$5,938] | 72 d | SAFE |
| 100K Swing | 8 lot | 0.0% | $7,833 [$4,410–$11,876] | 72 d | SAFE |
| 200K Swing | 16 lot | 0.0% | $15,665 [$8,821–$23,751] | 72 d | SAFE |
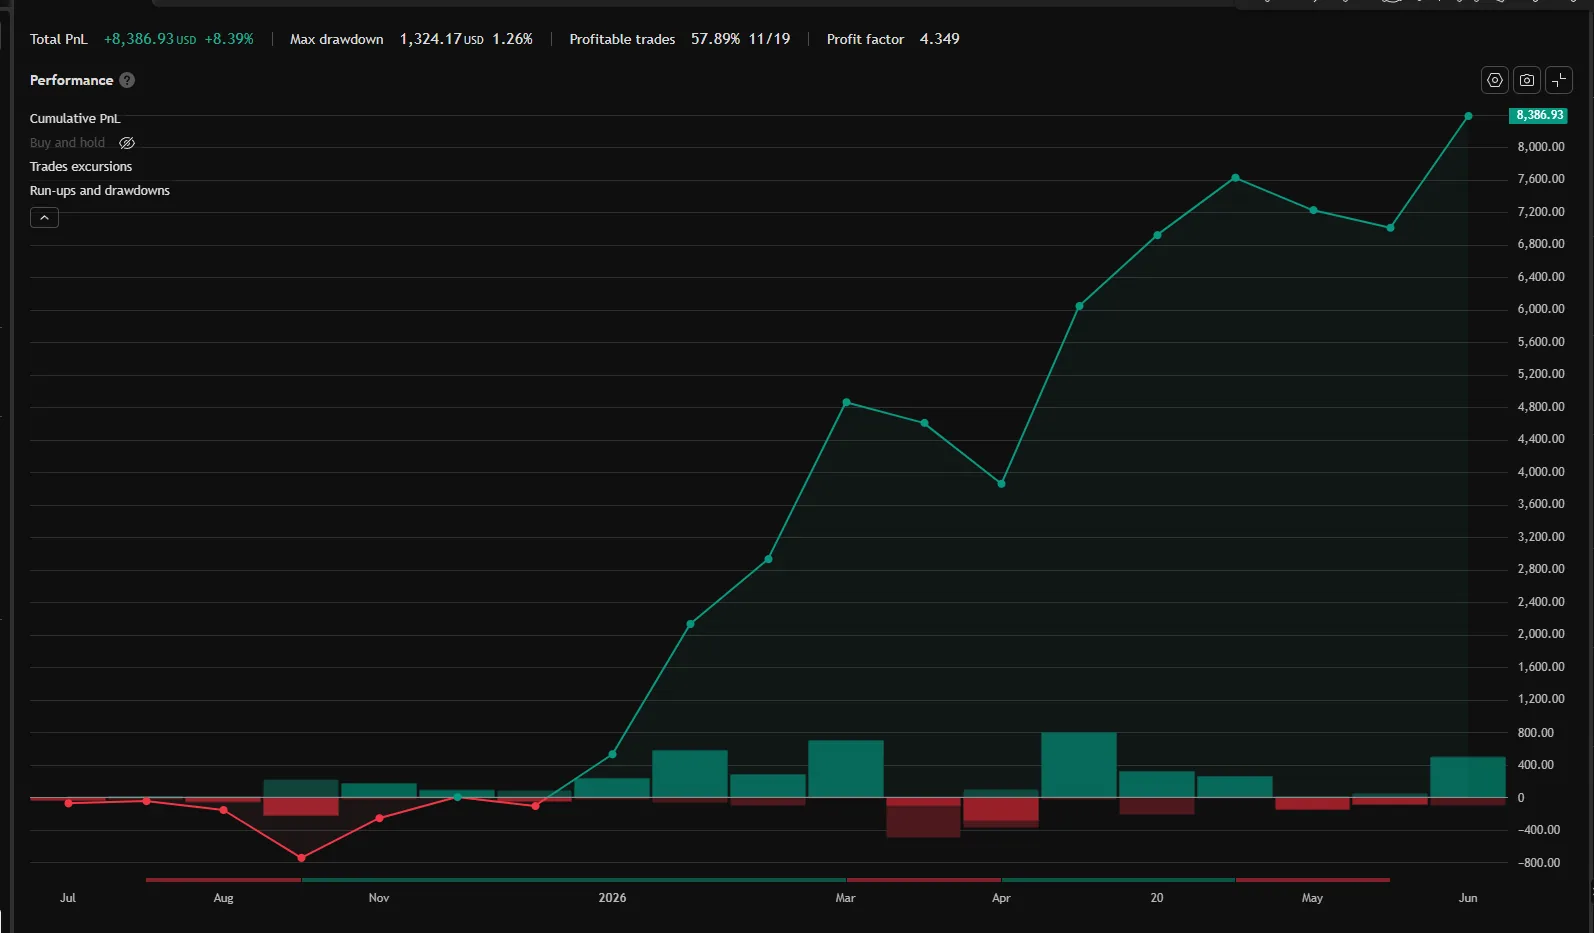
Equity curve · backtest + live
Daily P&L applied to the $100,000 starting balance at the 100K preset (0.3 lot), log scale. Gray = pre-publication (2025-04-01 → 2026-03-31); accent = live (2026-04-01 → 2026-06-30).
TradingView performance summary · last 4 quarters (Q3'25 — Q2'26)
Quarterly breakdown
| Quarter | Phase | Net | WR | Trades | Max DD (EOD) |
|---|---|---|---|---|---|
| Q3'25 | backtest | -$156 | 33.3% | 3 | $156 |
| Q4'25 | backtest | +$49 | 50.0% | 4 | $590 |
| Q1'26 | backtest | +$4,717 | 80.0% | 5 | $254 |
| Q2'26 live | live | +$3,778 | 57.1% | 7 | $750 |
Drawdowns are EOD basis; intrabar peak-to-trough runs higher.
Stats · backtest
| Avg win / loss | W:L | Largest win / loss | Max DD EOD | Sharpe | Sortino | Calmar | Avg bars |
|---|---|---|---|---|---|---|---|
| $760 / $197 | 3.86 | $1,932 / $590 | $1,770 (1.77%) | 1.68 (2.53 live) | 1.95 | 2.96 | 12.0 |
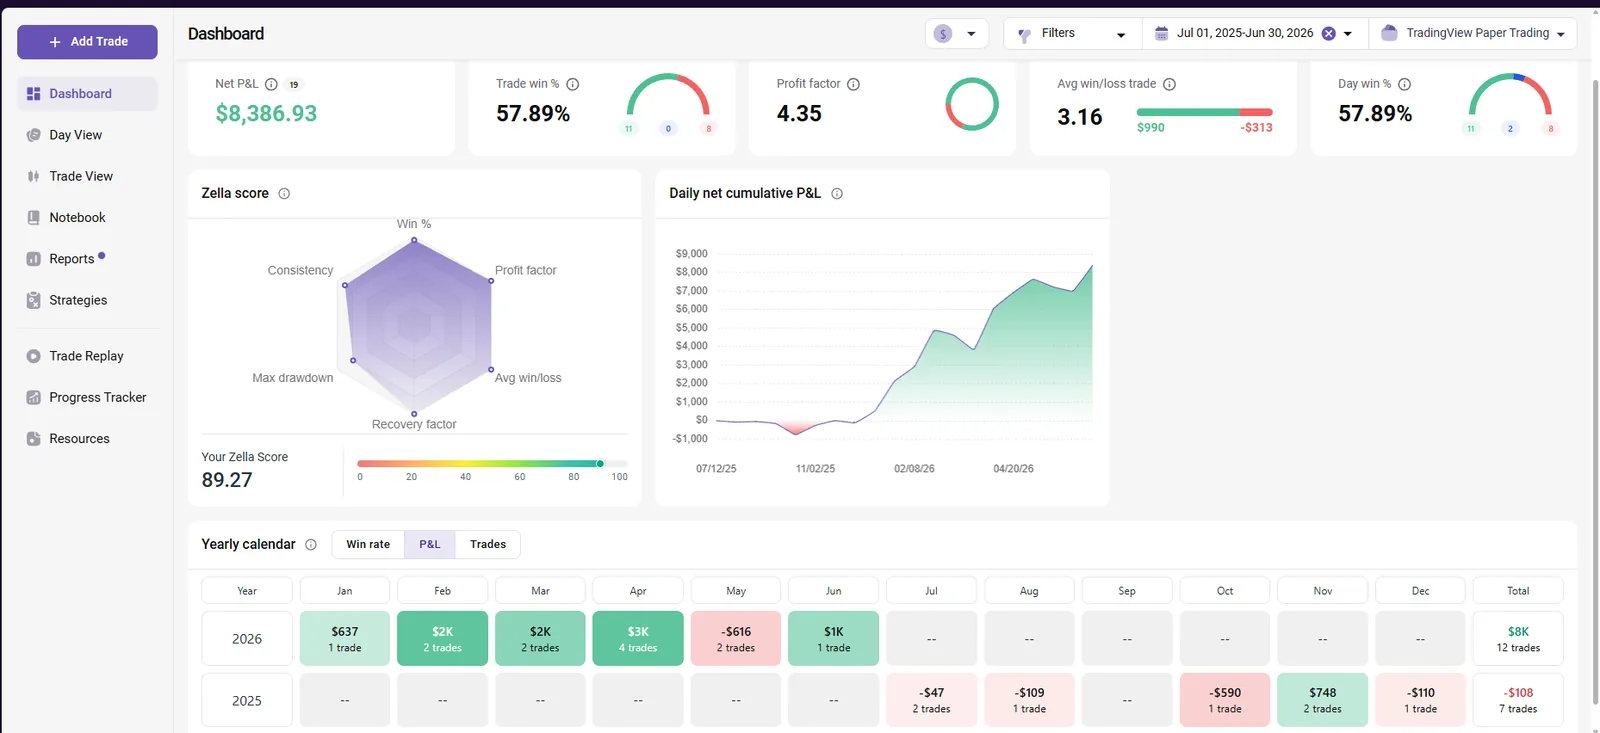
Account sizing · Monte Carlo 1,500 paths × 3y
| Account | Qty | Blow/y | Net/y P50 [P10–P90] | Median TTP | Status |
|---|---|---|---|---|---|
| 50K Swing | 0.15 lot | 0.04% | $3,172 [$1,978–$4,506] | 75 d | SAFE |
| 100K Swing | 0.3 lot | 0.0% | $6,344 [$3,956–$9,012] | 75 d | SAFE |
| 200K Swing | 0.6 lot | 0.0% | $12,689 [$7,911–$18,025] | 75 d | SAFE |
Risk disclosure
Backtest Q2'25–Q1'26 plus live Q2'26 at the stated presets. Past performance, simulated or live, does not guarantee future results. Futures and CFD trading involves substantial risk of loss; prop-firm accounts add breach rules (daily/EOD drawdown) that can terminate an account regardless of long-term edge. Size accordingly.
How Gap works
Gap trades the weekly gap — the price dislocation between Friday's close and Sunday's open. When markets reopen, that gap becomes a magnet and a battleground: price either travels back to fill it, or rejects it and continues away. Gap is built to capture both behaviours with strict, pre-defined entry conditions.
Because a tradeable weekly gap only forms under specific conditions, signals are sparse by design — under 30 trades per instrument across the 12-month backtest. That selectivity is where the edge concentrates: profit factors range from 3.51 (XAU) to 10.13 (NAS), the highest in the roster. The exact qualification filters, entry triggers and exit logic are proprietary and hardcoded in the script.
Gap runs on all four instruments (MNQ, MGC, NAS, XAU). On futures it is sized for EOD Trailing prop accounts; on forex it runs as a swing strategy on 50K/100K/200K tiers. Low trade frequency keeps drawdown contributions small, which is why Gap slots into the new Precision portfolios as the anchor component.
How these numbers were calculated
Trade counts, win rates, profit factors, drawdown values come directly from TradingView Strategy Tester for the baseline preset shown. Verify by running the strategy in your own TradingView after purchase — numbers match 1:1.
DD%, SL%, Pass:Blow ratio and percentile breakdowns are computed from the same trade list using industry-standard methodology. Anyone with the raw trade list can reproduce these in Excel or Python.
Time-to-payout, Pay/y, Net $/y, Blow rate, and Viability in the sizing table come from a 1,500-path Monte Carlo v6 simulation over a 3-year horizon. Block bootstrap (5-day blocks) preserves serial autocorrelation of trade streaks.
Get Gap + 6 more strategies.
Gap ships in every tier — Single Bundle, Track Combo and Ultimate — together with Open, Trace, Hook, Anchor, Pivot and Reject. TradingView invite access, sizing presets for every prop tier, monthly updates.