Hook
Multi-leg Sweep
Hook waits for liquidity to be taken on one side of a recent swing, then waits for a multi-leg confirmation that price is rejecting back through the swept level. Three legs of confirmation before any entry. Selective by design — trade count stays low but each entry is high-conviction. Backtest Q2'25–Q1'26 + live Q2'26: best PF 3.45 (NAS), combined +$11,251 backtest / +$3,899 live at 100K presets.
At a glance
Best-performing instrument per metric (max 3 from one instrument). Rolling last 12 months at 100K preset; forecast metrics from 1,500-path Monte Carlo, 3-year horizon. Viability 3y = % of MC paths that never hit the hard drawdown. Payouts : blow = payouts per one account blow over 3y. TTP = median days to first payout.
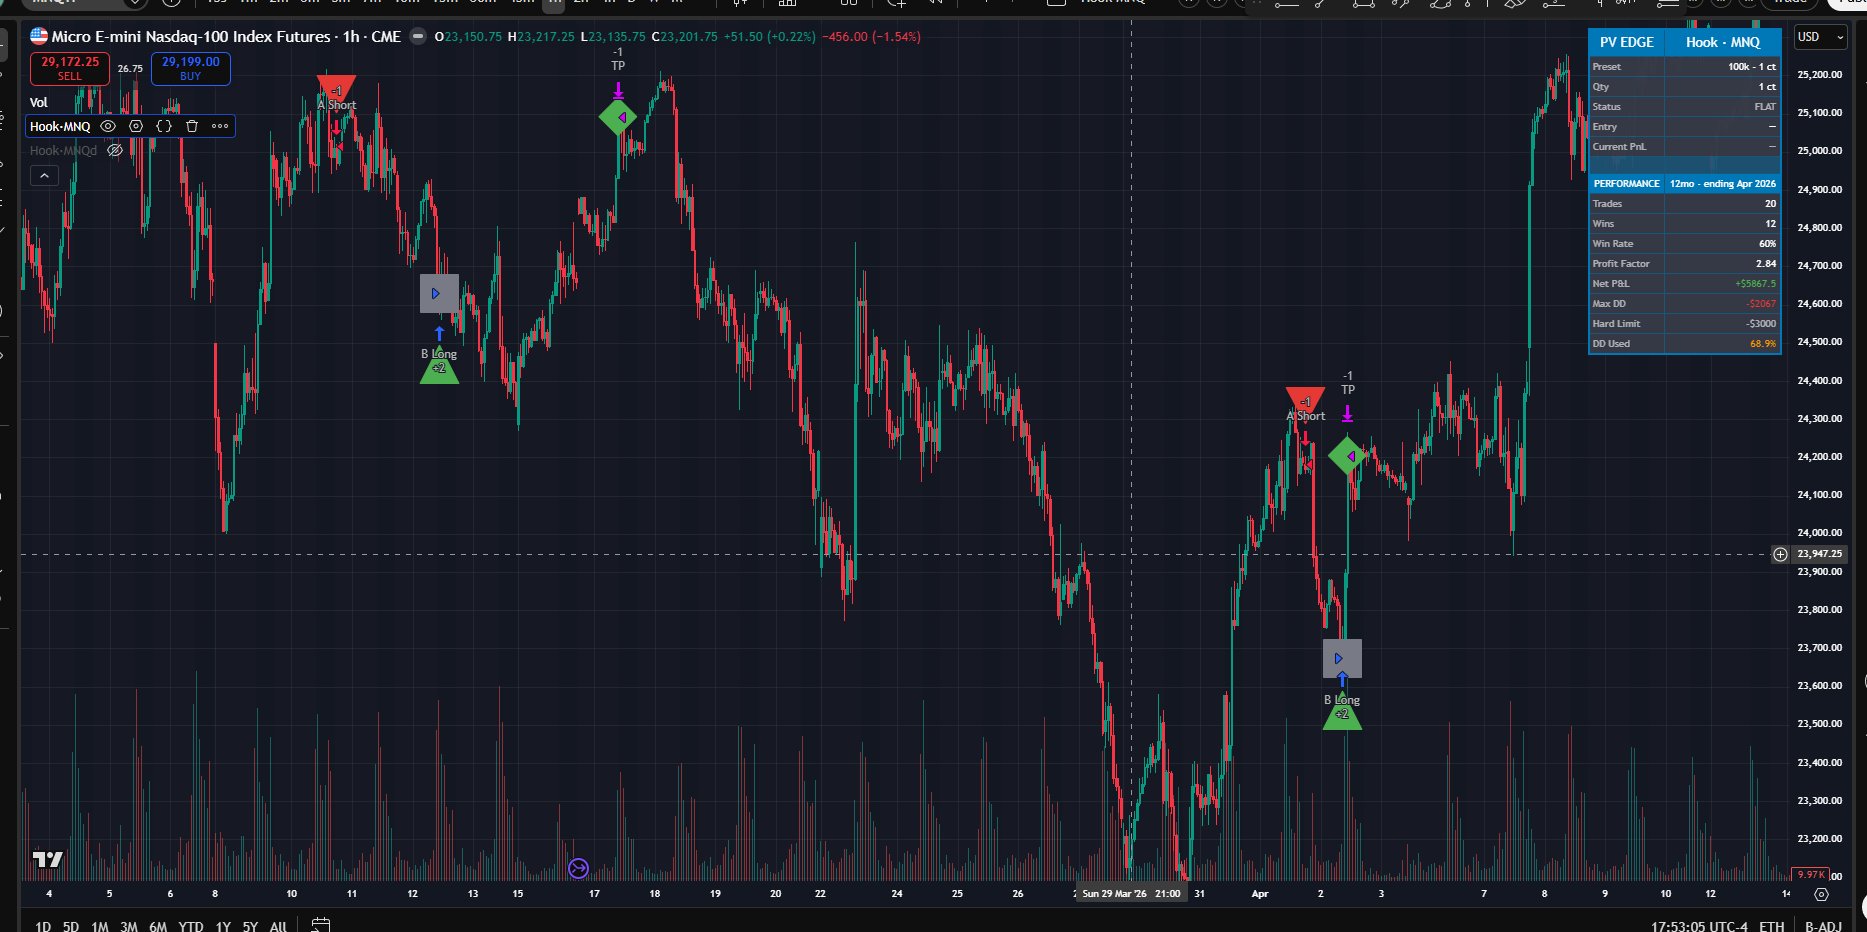
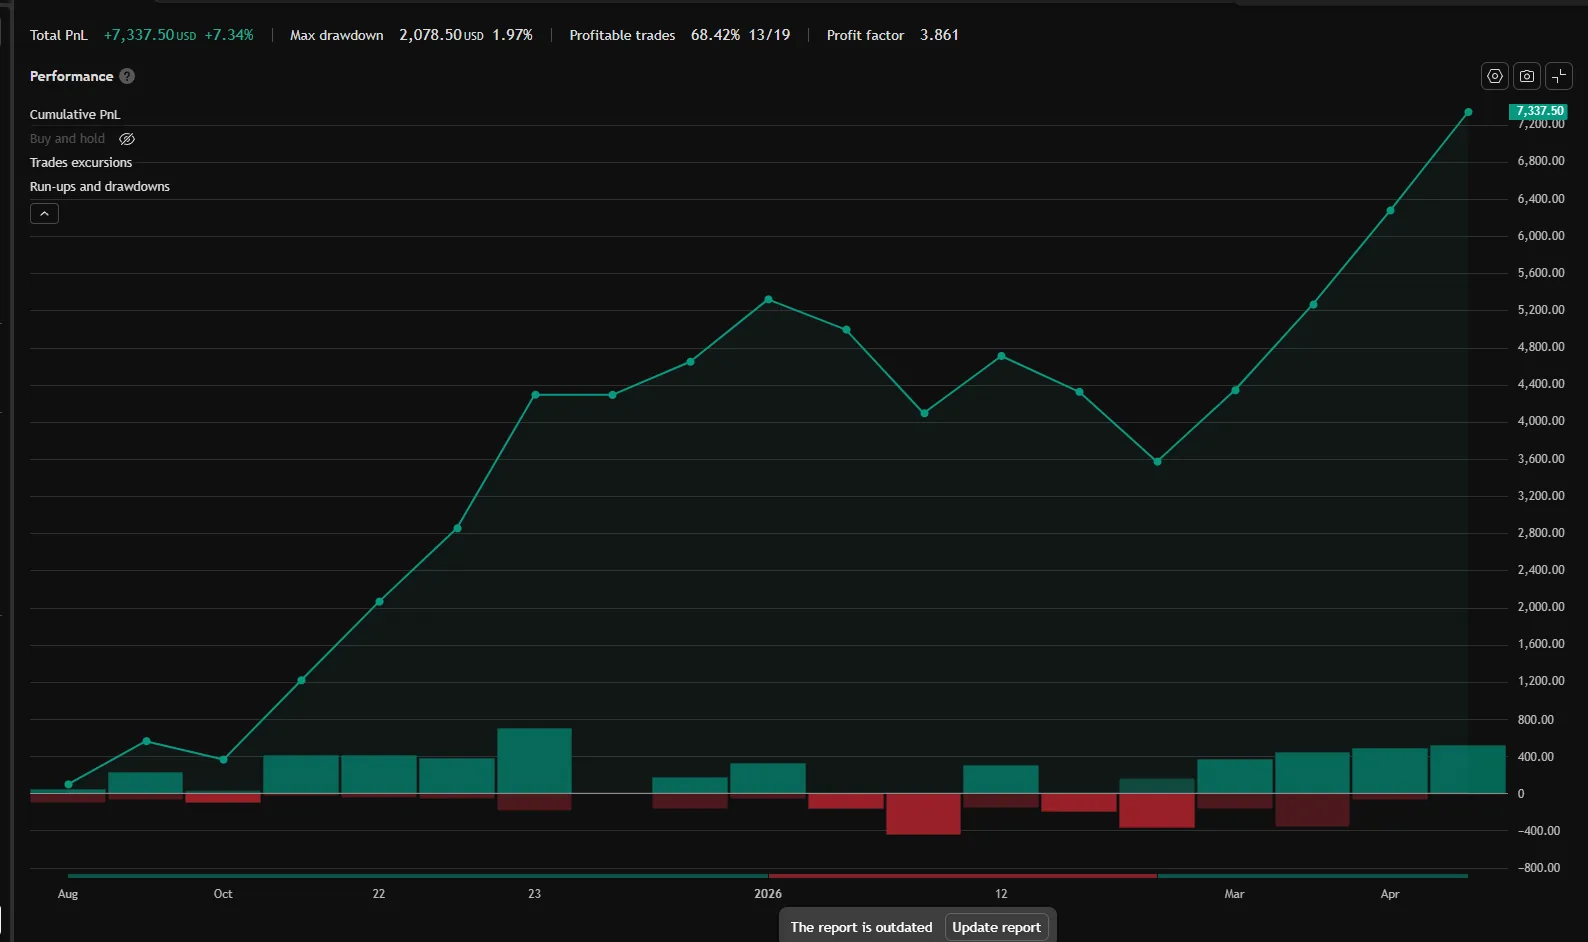
Equity curve · backtest + live
Daily P&L applied to the $100,000 starting balance at the 100K preset (1 ct), log scale. Gray = pre-publication (2025-04-01 → 2026-03-31); accent = live (2026-04-01 → 2026-06-30).
TradingView performance summary · last 4 quarters (Q3'25 — Q2'26)
Quarterly breakdown
| Quarter | Phase | Net | WR | Trades | Max DD (EOD) |
|---|---|---|---|---|---|
| Q3'25 | backtest | +$281 | 100.0% | 2 | $0 |
| Q4'25 | backtest | +$2,043 | 71.4% | 7 | $99 |
| Q1'26 | backtest | +$308 | 50.0% | 8 | $538 |
| Q2'26 live | live | +$1,037 | 100.0% | 2 | $0 |
Drawdowns are EOD basis; intrabar peak-to-trough runs higher.
Stats · backtest
| Avg win / loss | W:L | Largest win / loss | Max DD EOD | Sharpe | Sortino | Calmar | Avg bars |
|---|---|---|---|---|---|---|---|
| $356 / $214 | 1.66 | $720 / $451 | $538 (0.54%) | 1.81 (1.97 live) | 0.94 | 4.72 | 19.0 |
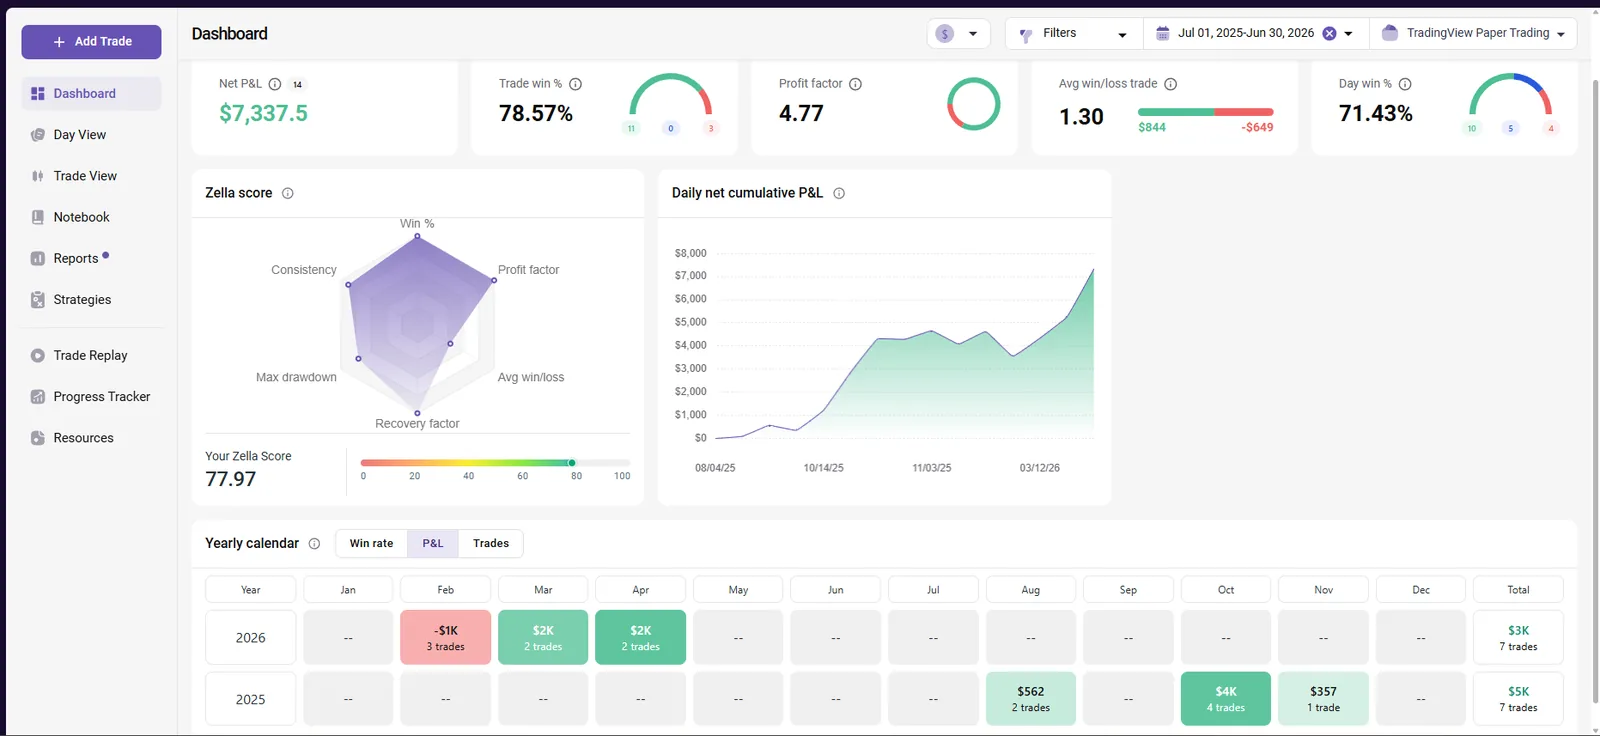
Account sizing · Monte Carlo 1,500 paths × 3y
| Account | Qty | Blow/y | Net/y P50 [P10–P90] | Median TTP | Status |
|---|---|---|---|---|---|
| 50K FP | 1 ct | 0.02% | $2,791 [$1,595–$4,134] | 235 d | SAFE |
| 100K FP | 1 ct | 0.0% | $2,791 [$1,595–$4,134] | 317 d | SAFE |
| 150K FP | 2 ct | 0.0% | $5,583 [$3,191–$8,268] | 232 d | SAFE |
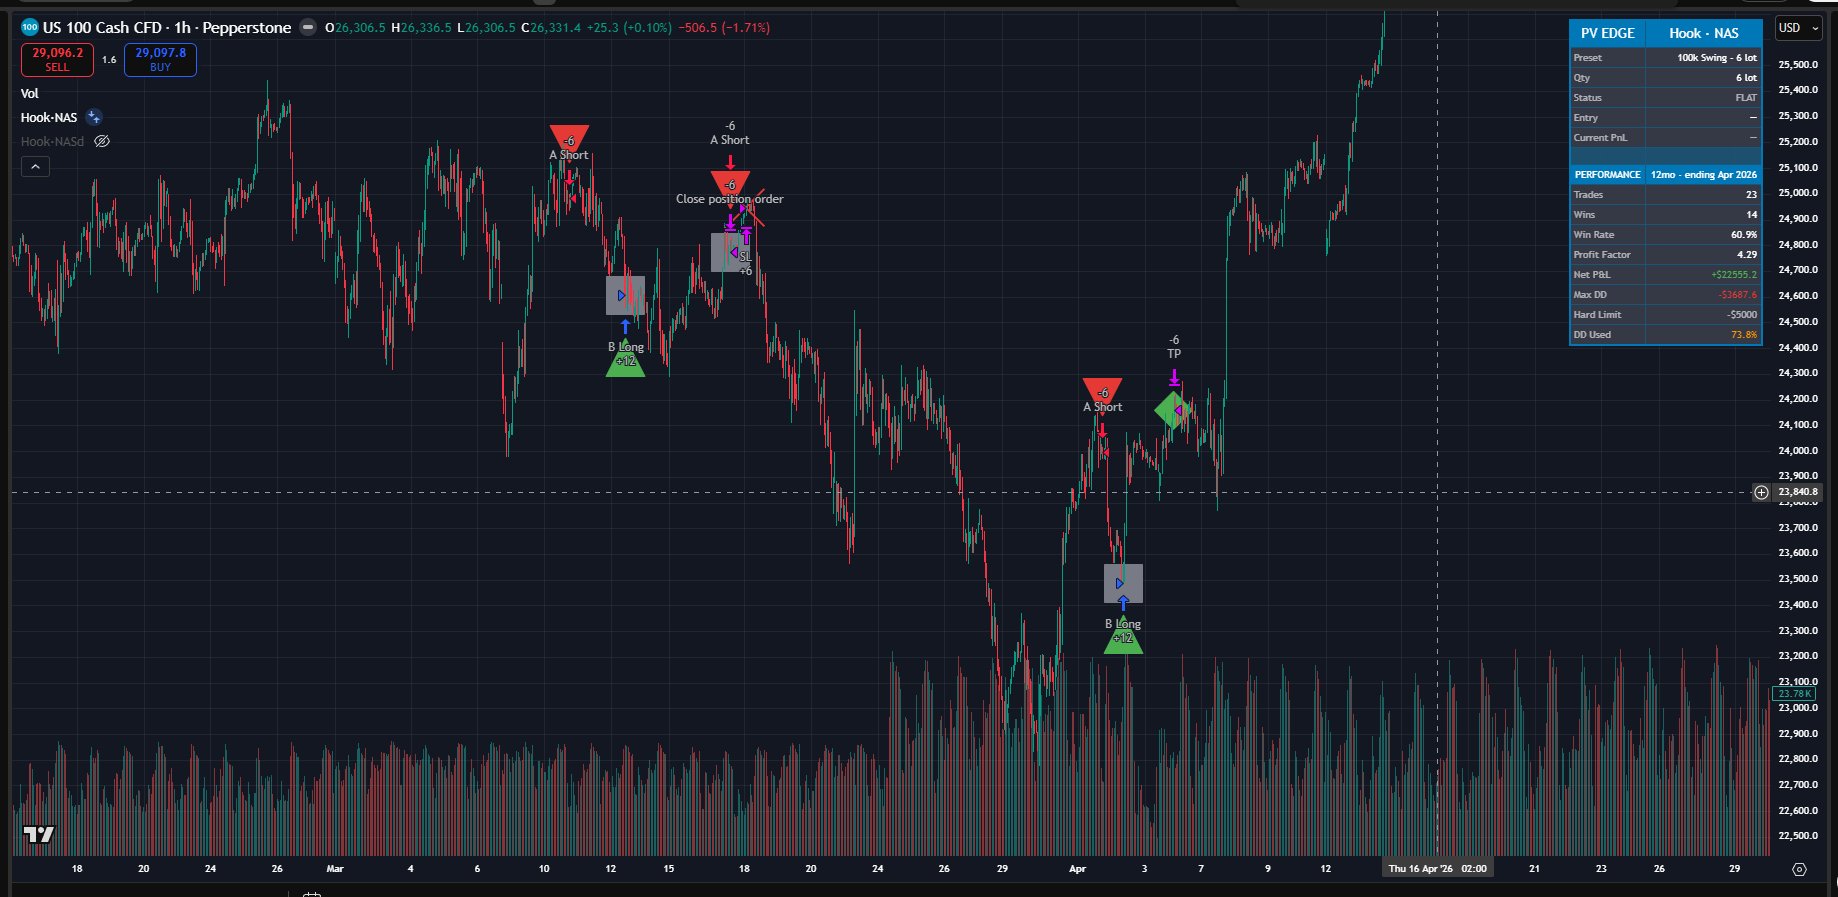
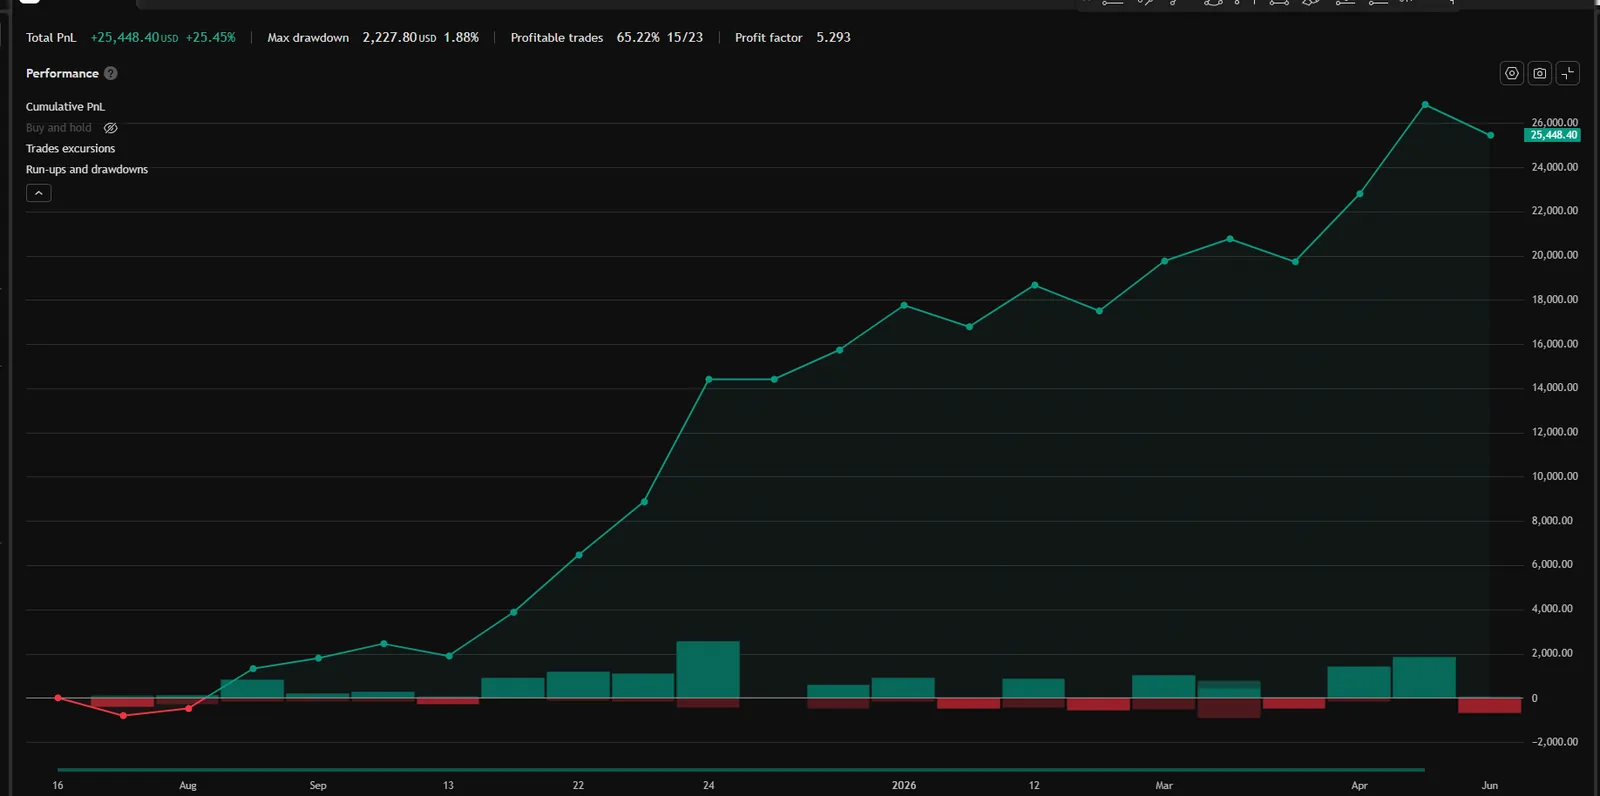
Equity curve · backtest + live
Daily P&L applied to the $100,000 starting balance at the 100K preset (6 lot), log scale. Gray = pre-publication (2025-04-01 → 2026-03-31); accent = live (2026-04-01 → 2026-06-30).
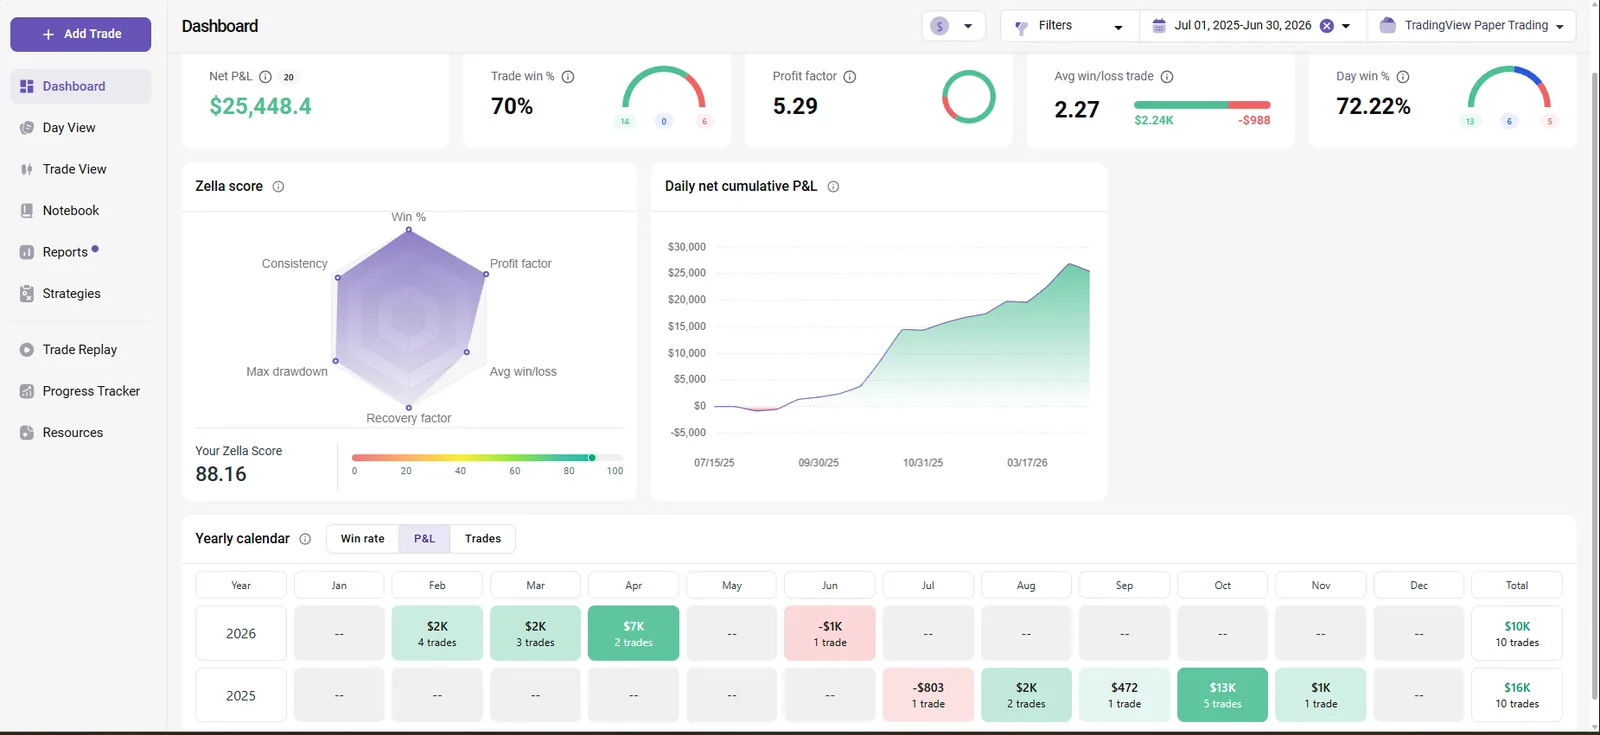
TradingView performance summary · last 4 quarters (Q3'25 — Q2'26)
Quarterly breakdown
| Quarter | Phase | Net | WR | Trades | Max DD (EOD) |
|---|---|---|---|---|---|
| Q3'25 | backtest | +$897 | 60.0% | 5 | $402 |
| Q4'25 | backtest | +$6,968 | 75.0% | 8 | $279 |
| Q1'26 | backtest | +$1,998 | 57.1% | 7 | $518 |
| Q2'26 live | live | +$2,862 | 66.7% | 3 | $695 |
Drawdowns are EOD basis; intrabar peak-to-trough runs higher.
Stats · backtest
| Avg win / loss | W:L | Largest win / loss | Max DD EOD | Sharpe | Sortino | Calmar | Avg bars |
|---|---|---|---|---|---|---|---|
| $933 / $319 | 2.92 | $2,772 / $932 | $1,645 (1.64%) | 1.92 (2.14 live) | 1.61 | 5.06 | 17.0 |
Account sizing · Monte Carlo 1,500 paths × 3y
| Account | Qty | Blow/y | Net/y P50 [P10–P90] | Median TTP | Status |
|---|---|---|---|---|---|
| 50K Swing | 3 lot | 0.0% | $4,791 [$3,143–$6,935] | 62 d | SAFE |
| 100K Swing | 6 lot | 0.0% | $9,583 [$6,286–$13,871] | 62 d | SAFE |
| 200K Swing | 12 lot | 0.0% | $19,166 [$12,571–$27,742] | 62 d | SAFE |
Risk disclosure
Backtest Q2'25–Q1'26 plus live Q2'26 at the stated presets. Past performance, simulated or live, does not guarantee future results. Futures and CFD trading involves substantial risk of loss; prop-firm accounts add breach rules (daily/EOD drawdown) that can terminate an account regardless of long-term edge. Size accordingly.
How Hook works
Hook operates on the liquidity-sweep + reversal premise: institutional flow takes out the previous swing low/high (running stops), then prints rejection structure as buyers/sellers absorb the move. The strategy waits for two additional confirmation legs before entering on the third — filtering out continuation sweeps that just keep going.
Selectivity is the point. Hook produces ~25–40 trades per year on MNQ and ~30 on NAS — an order of magnitude less than Open (114/yr on MGC). The trade-off: high win rate, high profit factor, and very low blow rate (0% on NAS, 0.7%/yr on 100K MNQ).
Exits use a fixed initial stop at the failed sweep wick + a profit target derived from the swing's measured move. EOD GUARD closes any open position 5 minutes before close to avoid overnight exposure on futures. Average holding period: ~3 hours on 5m timeframe.
Sizing on MNQ is conservative (1–2 ct on 50K–150K accounts) because Hook's setups occasionally cluster on consolidation breakouts — the smaller size protects against day-of-week stacking. NAS sizing (6 lot on Forex Prop) reflects the wider Forex Prop daily-loss buffer.
How these numbers were calculated
Trade counts, win rates, profit factors, drawdown values come directly from TradingView Strategy Tester for the baseline preset. Verify by running the strategy in your own TradingView after purchase — numbers match 1:1.
DD%, SL%, Pass:Blow ratio and percentile breakdowns are computed from the same trade list using industry-standard methodology. Reproducible in Excel or Python.
Time-to-payout, Pay/y, Net $/y, Blow rate, and Viability come from a 1,500-path Monte Carlo v6 simulation over a 3-year horizon. Block bootstrap (5-day blocks) preserves serial autocorrelation of trade streaks.
Get Hook + 5 more strategies.
Every Puravida Edge plan includes all 7 strategies and ongoing updates. Founders pricing: limited early-supporter Lifetime spots at 30% off.