Reject
Rejection Wick
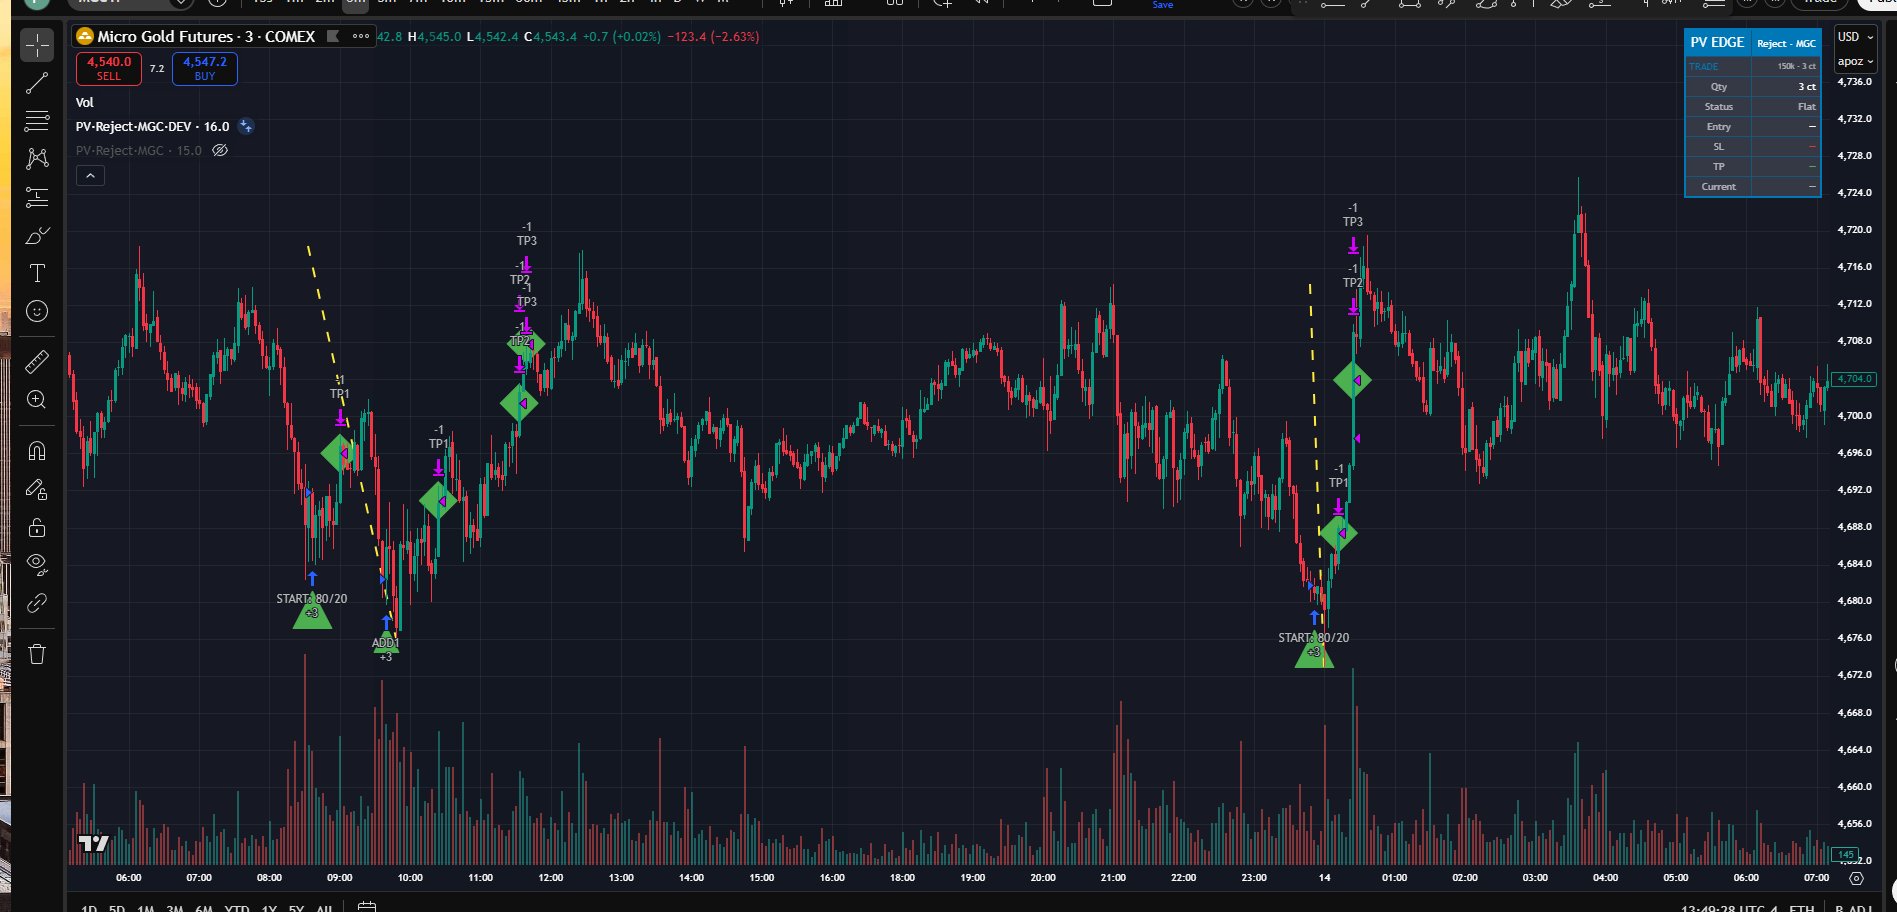
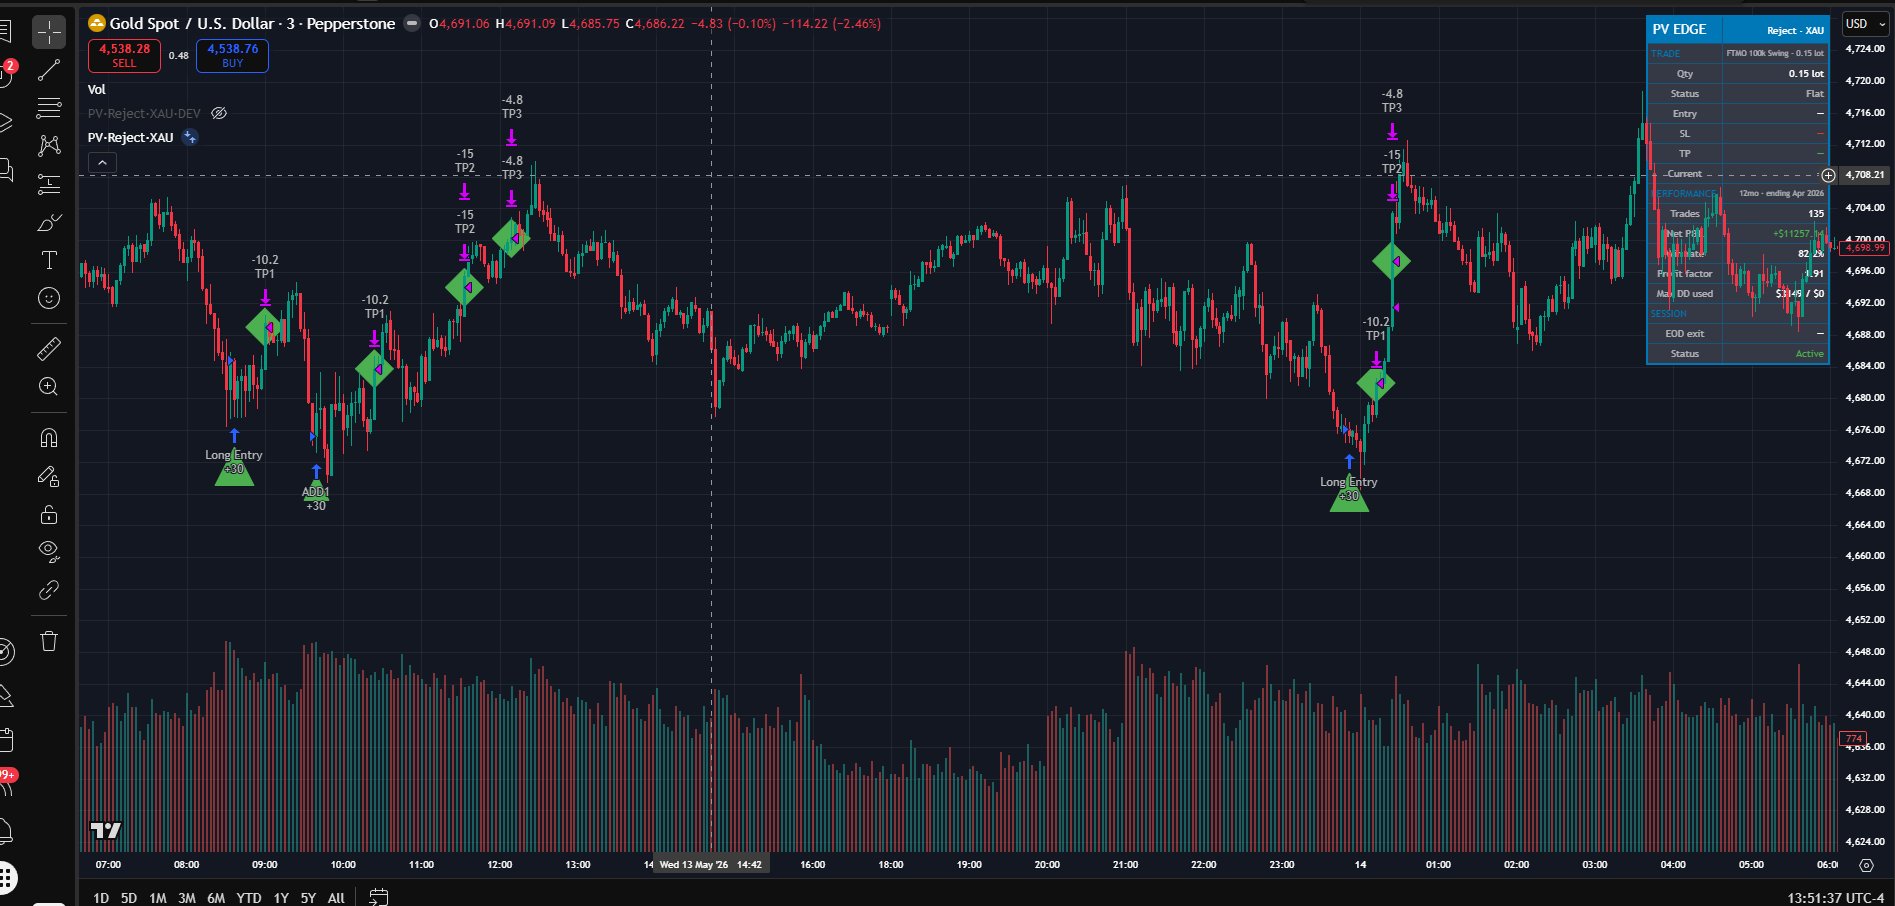
Reject trades the exhaustion of an overextended move. Gold specialist on MGC and XAU. Total +$17,806 across all tracks at 100K presets (Apr 2025 – Sep 2026): modeled +$16,185, live +$1,620; best PF 4.64 (MGC).
At a glance
4.64 best PF (MGC) · 92.8% best WR (XAU)
Best-performing instrument per metric (max 3 from one instrument), total Apr 2025 – Sep 2026 at the 100K preset; modeled and live layers per instrument below. Forecast metrics: Monte Carlo, 1,500 paths, 3-year horizon, input Apr 2025 – Sep 2026. Viability 3y = % of MC paths that never hit the hard drawdown. Payout potential : blow = full payout units reached in profit per one account blow over 3y (potential, not a payout schedule). TTP = median days to first payout unit.
Take Reject’s numbers with you.
The Playbook puts Reject next to every other strategy and portfolio in the catalogue, modeled and live shown separately, with the preset for each account tier. One PDF, then our letters with what the systems did.
By email, from Puerto Viejo, Costa Rica. Unsubscribe anytime.
150K FP preset (risk 1500 USD (2 ct @4350)) · portfolio-only
4.64 PF · 84.5% Win rate · $1,318 Max DD (EOD) · 2.04 Sharpe
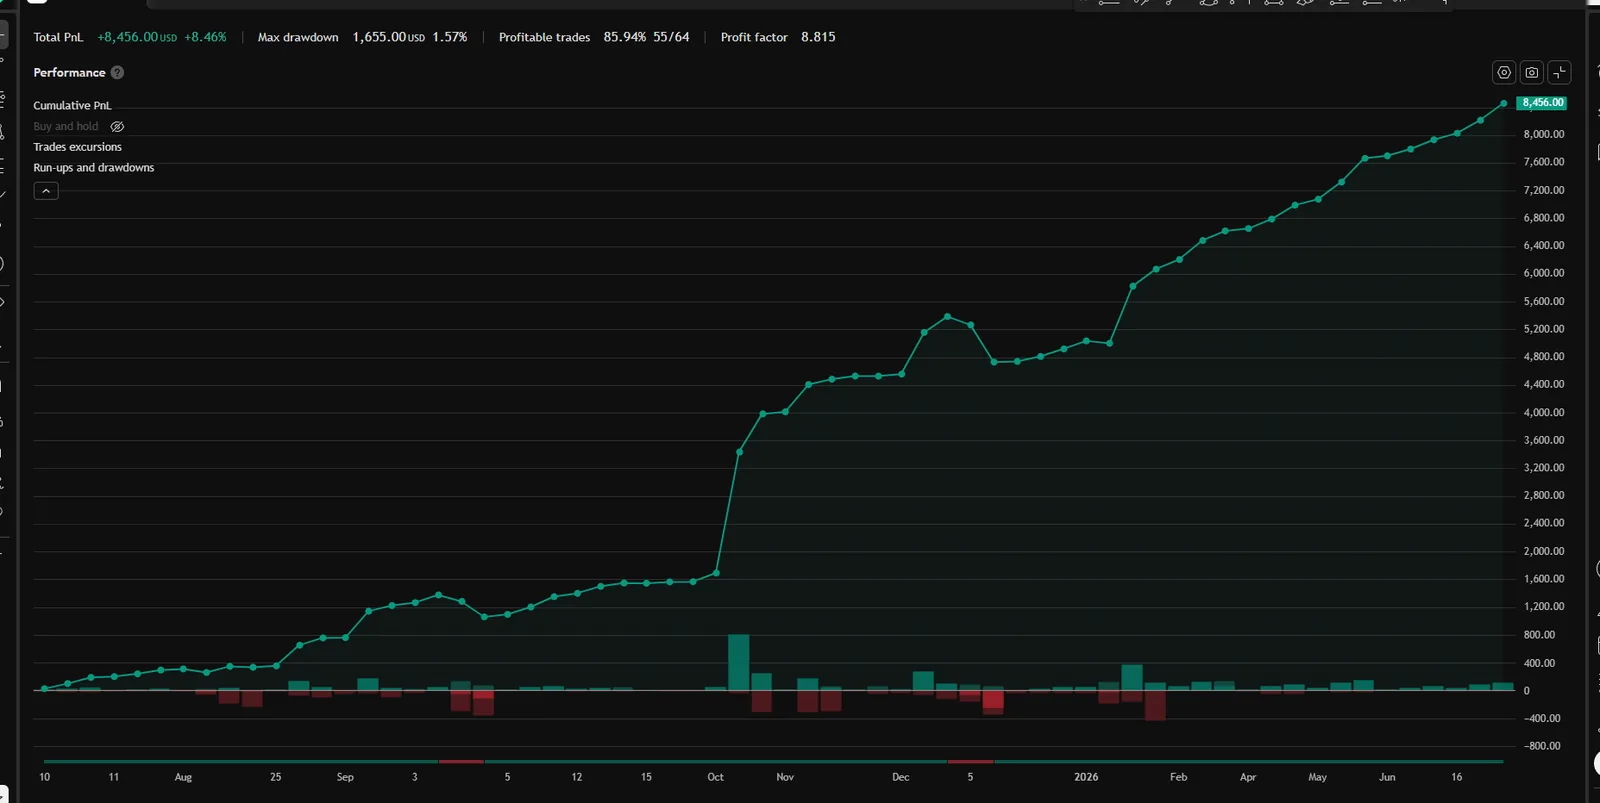
Equity curve · modeled + live
Daily P&L applied to the $150,000 starting balance at the 150K FP preset (risk 1500 USD (2 ct @4350)), log scale. Gray = modeled (2025-04-01 → 2026-03-31); accent = live (2026-04-01 → 2026-09-30), right of the “LIVE →” marker.
Modeled 12 months (Apr 2025 – Mar 2026) · detail
Quarterly breakdown · modeled Q2'25–Q1'26, live since Q2'26
| Quarter | Layer | Net | WR | Trades | Max DD (EOD) |
|---|---|---|---|---|---|
| Q2'25 | modeled | +$3,663 | 90.5% | 42 | $301 |
| Q3'25 | modeled | +$1,155 | 80.0% | 25 | $159 |
| Q4'25 | modeled | +$2,127 | 80.0% | 15 | $438 |
| Q1'26 | modeled | +$3,671 | 87.5% | 8 | $0 |
| Q2'26 live | live | +$281 | 83.3% | 12 | $872 |
| Q3'26 live | live | +$793 | 78.6% | 14 | $1,318 |
Drawdowns are EOD basis; intrabar peak-to-trough runs higher. Live quarters are real-account results at the same preset.
Stats · modeled and live, separately
| Layer | Avg win / loss | W:L | Largest win / loss | Max DD EOD | Sharpe | Sortino | Calmar | Avg bars |
|---|---|---|---|---|---|---|---|---|
| Modeled Apr 2025 – Mar 2026 | $151 / −$78 | 1.94 | $2,130 / −$358 | $438 (0.29%) | 2.70 | 17.54 | 24.24 | 75.9 |
| Live Apr 2026 – Sep 2026 | $156 / −$438 | 0.36 | $848 / −$728 | $1,318 (0.88%) | 0.61 | 0.87 | 1.63 | 31.1 |
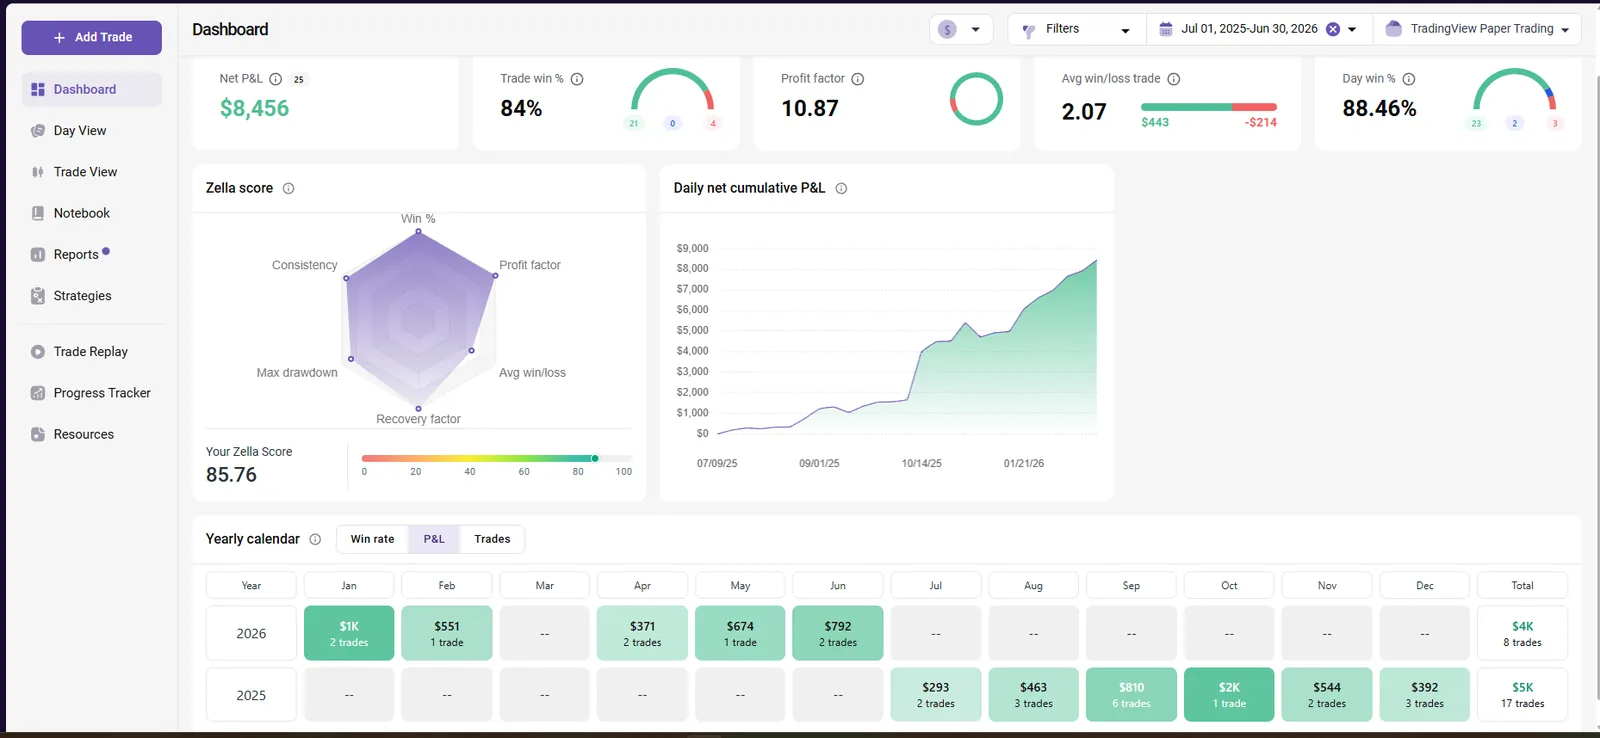
TradeZella merges partial exits into one position, so its trade count runs below the TradingView trade list; net P&L matches to the dollar.
Account sizing · Monte Carlo 1,500 paths × 3y
| Account | Qty | Blow/y | Net/y P50 (MC) | Median TTP | Status |
|---|---|---|---|---|---|
| 50K FP | — | — | — | — | EXCLUDED |
| 100K FP | — | — | — | — | EXCLUDED |
| 150K FP | 1,500 USD budget | 0.00% | $5,091 | 357d | SAFE |
Monte Carlo, 1,500 paths, 3-year horizon, input Apr 2025 – Sep 2026. Forecast layer, separate from modeled and live results above. Drawdown floor: end-of-day trailing.
100K Swing preset (risk 1500 USD (~0.11 lot @4350)) · portfolio-only
3.22 PF · 92.8% Win rate · $1,496 Max DD (EOD) · 1.61 Sharpe
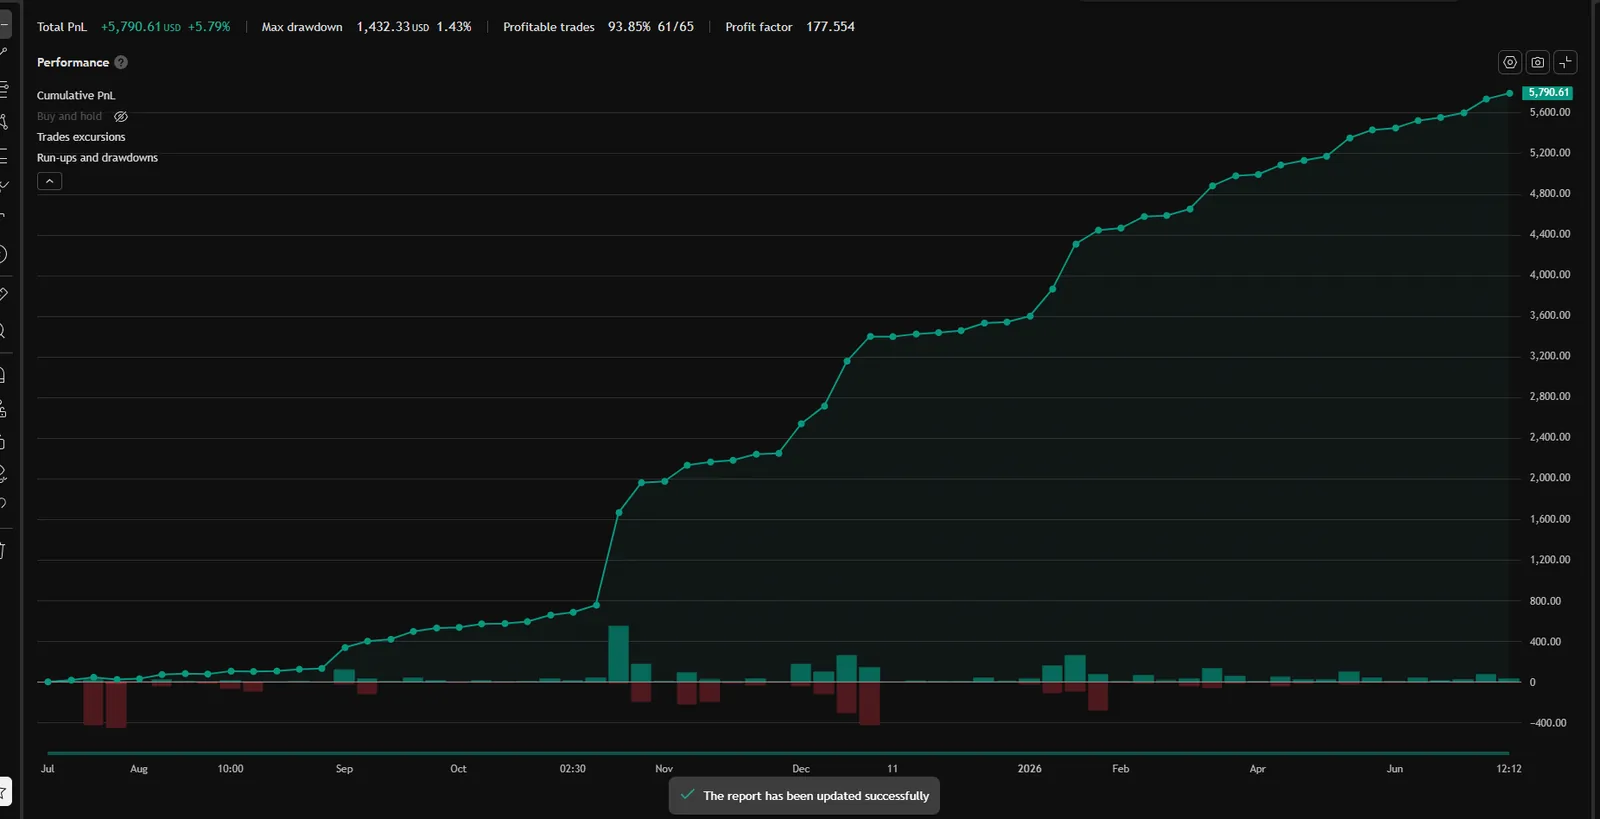
Equity curve · modeled + live
Daily P&L applied to the $100,000 starting balance at the 100K Swing preset (risk 1500 USD (~0.11 lot @4350)), log scale. Gray = modeled (2025-04-01 → 2026-03-31); accent = live (2026-04-01 → 2026-09-30), right of the “LIVE →” marker.
Modeled 12 months (Apr 2025 – Mar 2026) · detail
Quarterly breakdown · modeled Q2'25–Q1'26, live since Q2'26
| Quarter | Layer | Net | WR | Trades | Max DD (EOD) |
|---|---|---|---|---|---|
| Q2'25 | modeled | +$593 | 87.8% | 41 | $1,496 |
| Q3'25 | modeled | +$557 | 85.0% | 20 | $0 |
| Q4'25 | modeled | +$2,152 | 96.0% | 25 | $0 |
| Q1'26 | modeled | +$2,267 | 100.0% | 16 | $0 |
| Q2'26 live | live | −$731 | 85.7% | 14 | $1,222 |
| Q3'26 live | live | +$1,277 | 95.5% | 22 | $0 |
Drawdowns are EOD basis; intrabar peak-to-trough runs higher. Live quarters are real-account results at the same preset.
Stats · modeled and live, separately
| Layer | Avg win / loss | W:L | Largest win / loss | Max DD EOD | Sharpe | Sortino | Calmar | Avg bars |
|---|---|---|---|---|---|---|---|---|
| Modeled Apr 2025 – Mar 2026 | $76 / −$172 | 0.44 | $950 / −$835 | $1,496 (1.50%) | 2.08 | 3.41 | 3.72 | 159.4 |
| Live Apr 2026 – Sep 2026 | $54 / −$408 | 0.13 | $375 / −$661 | $1,222 (1.22%) | 0.49 | 0.57 | 0.89 | 65.2 |
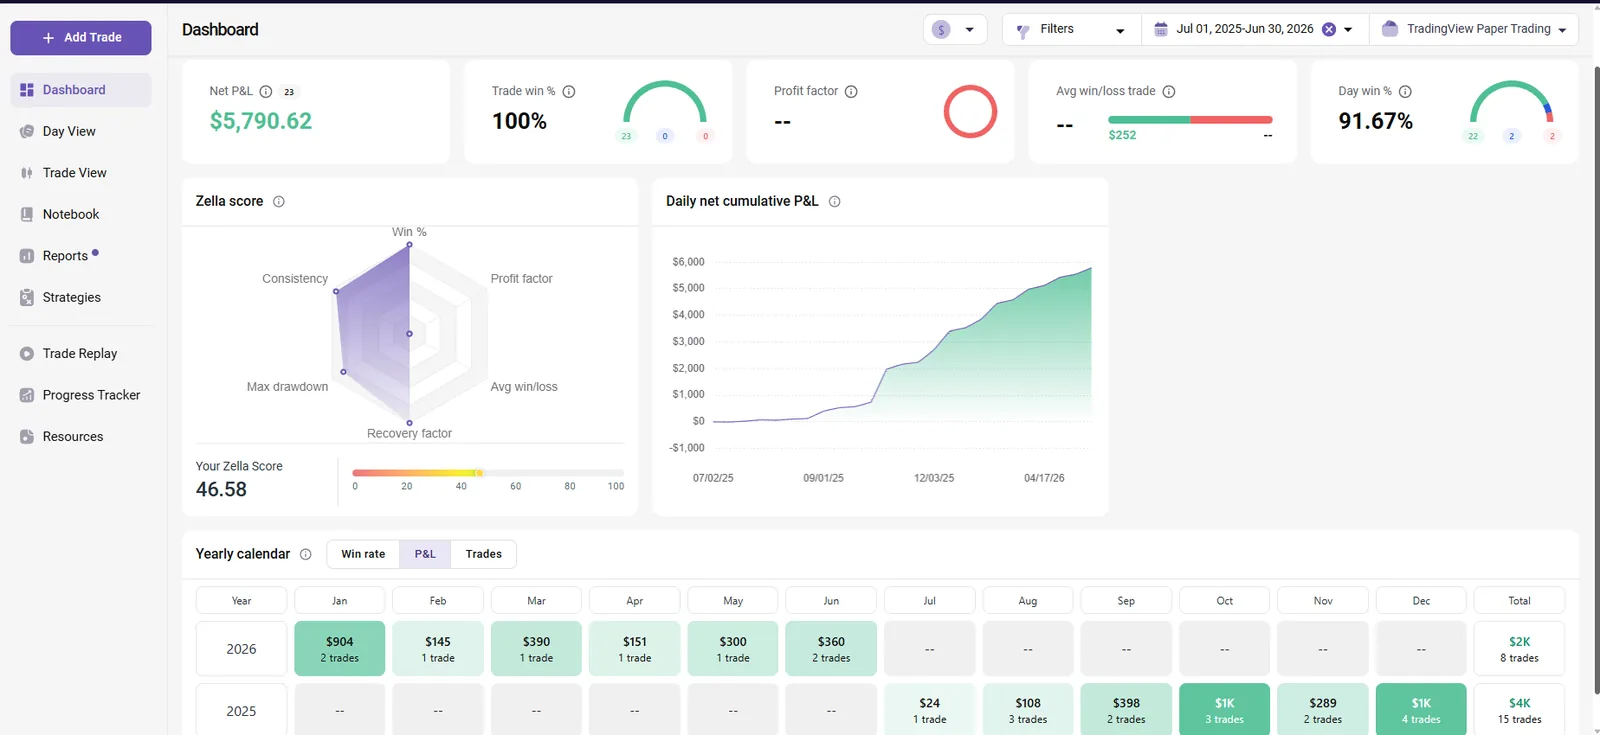
TradeZella merges partial exits into one position, so its trade count runs below the TradingView trade list; net P&L matches to the dollar.
Account sizing · Monte Carlo 1,500 paths × 3y
| Account | Qty | Blow/y | Net/y P50 (MC) | Median TTP | Status |
|---|---|---|---|---|---|
| 50K Swing | — | — | — | — | Custom |
| 100K Swing | 1,500 USD budget | 0.00% | $2,778 | 756d | SAFE |
| 200K Swing | 3,000 USD budget | 0.00% | $5,556 | 756d | SAFE |
Monte Carlo, 1,500 paths, 3-year horizon, input Apr 2025 – Sep 2026. Forecast layer, separate from modeled and live results above. Drawdown floor: static; swing account, positions may be held overnight.
Risk disclosure
Modeled Apr 2025 – Mar 2026 plus live Apr 2026 – Sep 2026 at the stated presets. Past performance, modeled or live, does not guarantee future results. Futures and CFD trading involves substantial risk of loss; prop-firm accounts add breach rules (daily/EOD drawdown) that can terminate an account regardless of long-term edge. Size accordingly.
How Reject works
Reject trades the exhaustion of an overextended move. The exact qualification filters, entry triggers and exit logic are proprietary and hardcoded in the script.
Reject MGC is available only on the largest Futures Prop account tier. On smaller tiers the minimum viable size produces stops too wide for the tighter daily-loss limits, so those presets are excluded.
On futures, Reject MGC runs on a risk budget (USD per position) rather than a fixed contract count. Its modeled blow rate, payout potential and net range are in the sizing table above; operate it with full awareness of the risk profile.
Both Reject variants show near-zero modeled blow rates; the MGC variant has the shallower drawdown relative to account size and the stronger risk-adjusted return.
How these numbers were calculated
Trade counts, win rates, profit factors, drawdown values come directly from TradingView Strategy Tester for the baseline preset. Verify by running the strategy in your own TradingView after purchase — numbers match 1:1.
DD%, SL%, payout potential : blow ratio and percentile breakdowns are computed from the same trade list using industry-standard methodology. Reproducible in Excel or Python.
Time-to-payout, payout potential, Net $/y, blow rate and viability come from a 1,500-path Monte Carlo simulation over a 3-year horizon (input Apr 2025 – Sep 2026). Block bootstrap (5-day blocks) preserves serial autocorrelation of trade streaks.
Get Reject + 9 more strategies.
Every Puravida Edge plan includes all 10 strategies and ongoing updates. Every Lifetime tier can be paid in 12 monthly instalments — full access from the first payment.
Get the closed trades by email, updated twice a week.
This month’s closed trades, newest first, grouped by day, with the total per portfolio — updated twice a week. Plus the Playbook.
By email, from Puerto Viejo, Costa Rica. Unsubscribe anytime.