Reject
Rejection Wick
Reject targets rejection-wick patterns at session highs/lows and key liquidity zones. Aggressive by design — it produces the high win rate in the entire roster (85% on MGC, 93% on XAU) with a strong profit factor (3.77 on MGC). Backtest Q2'25–Q1'26 + live Q2'26: best PF 152.79 (XAU), combined +$11,598 backtest / +$2,649 live at 100K presets.
At a glance
Best-performing instrument per metric (max 3 from one instrument). Rolling last 12 months at 100K preset; forecast metrics from 1,500-path Monte Carlo, 3-year horizon. Viability 3y = % of MC paths that never hit the hard drawdown. Payouts : blow = payouts per one account blow over 3y. TTP = median days to first payout.
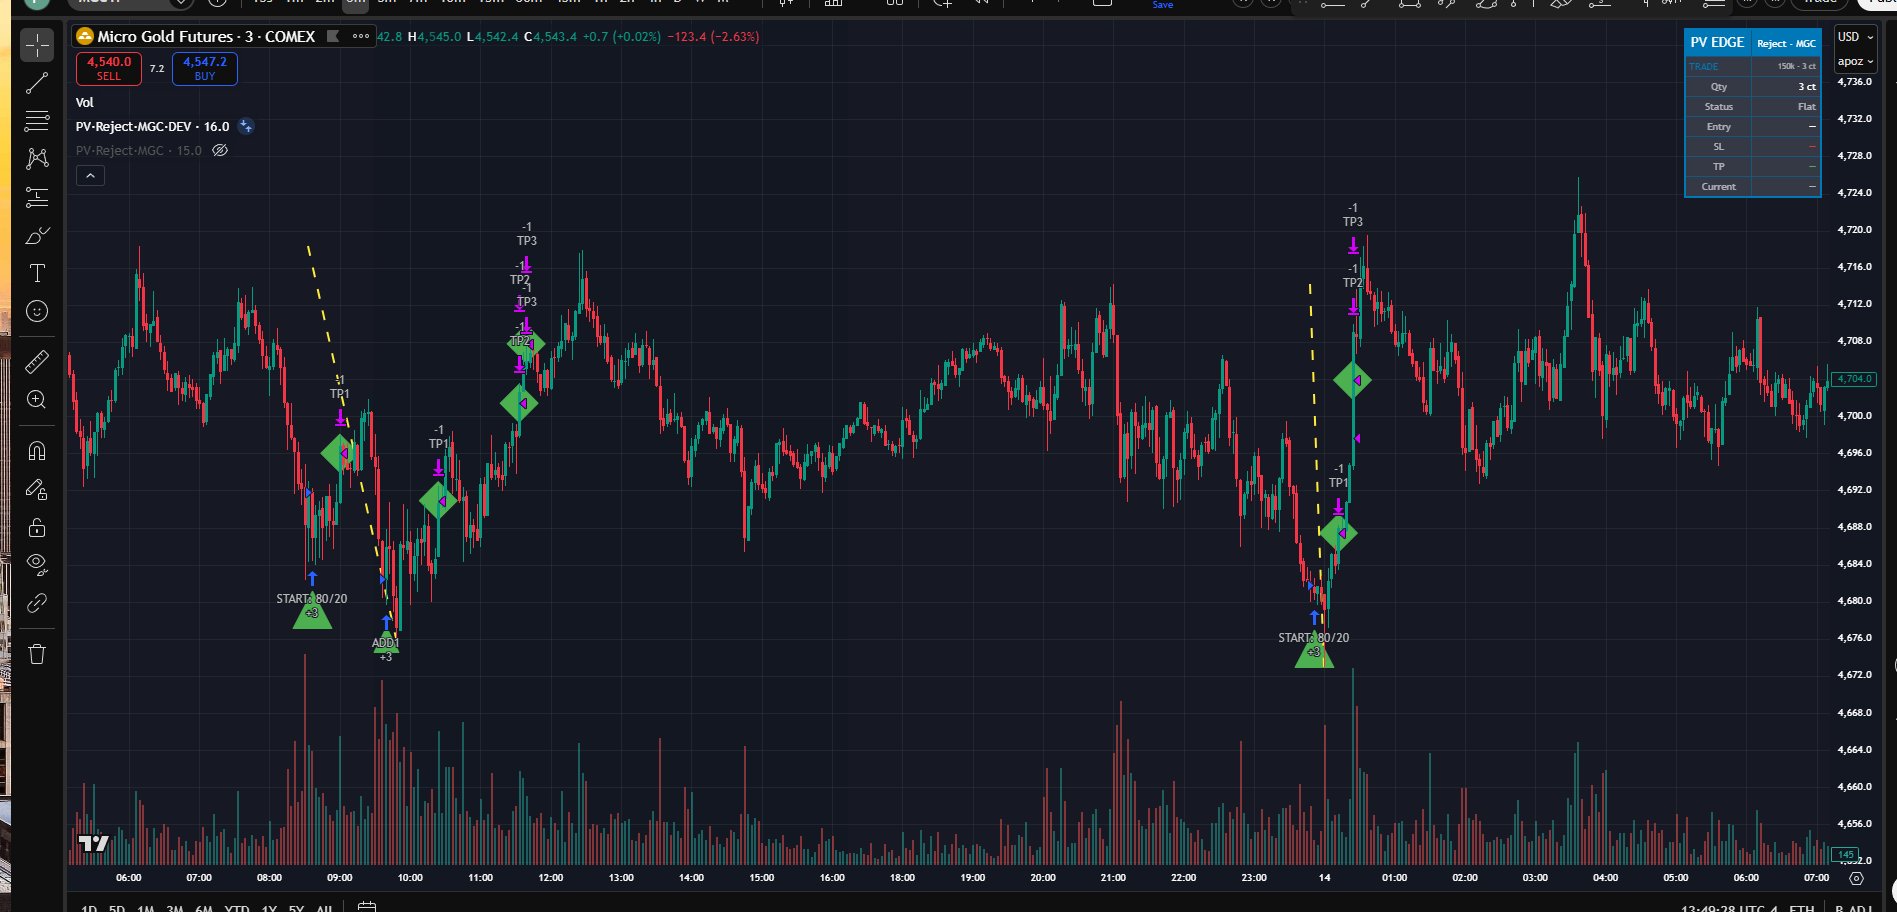
Equity curve · backtest + live
Daily P&L applied to the $100,000 starting balance at the 100K preset (3 ct), log scale. Gray = pre-publication (2025-04-01 → 2026-03-31); accent = live (2026-04-01 → 2026-06-30).
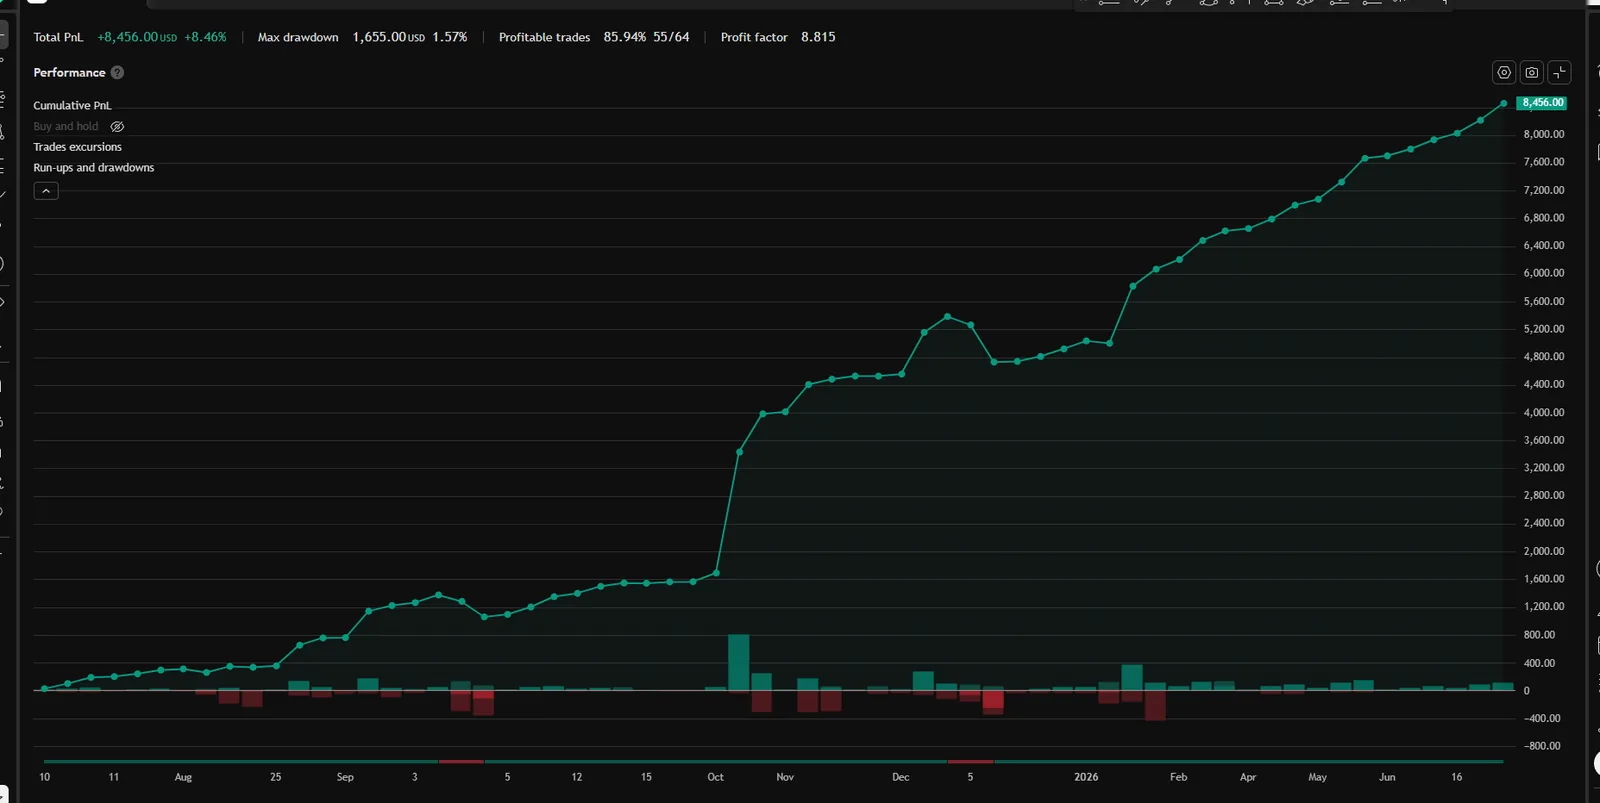
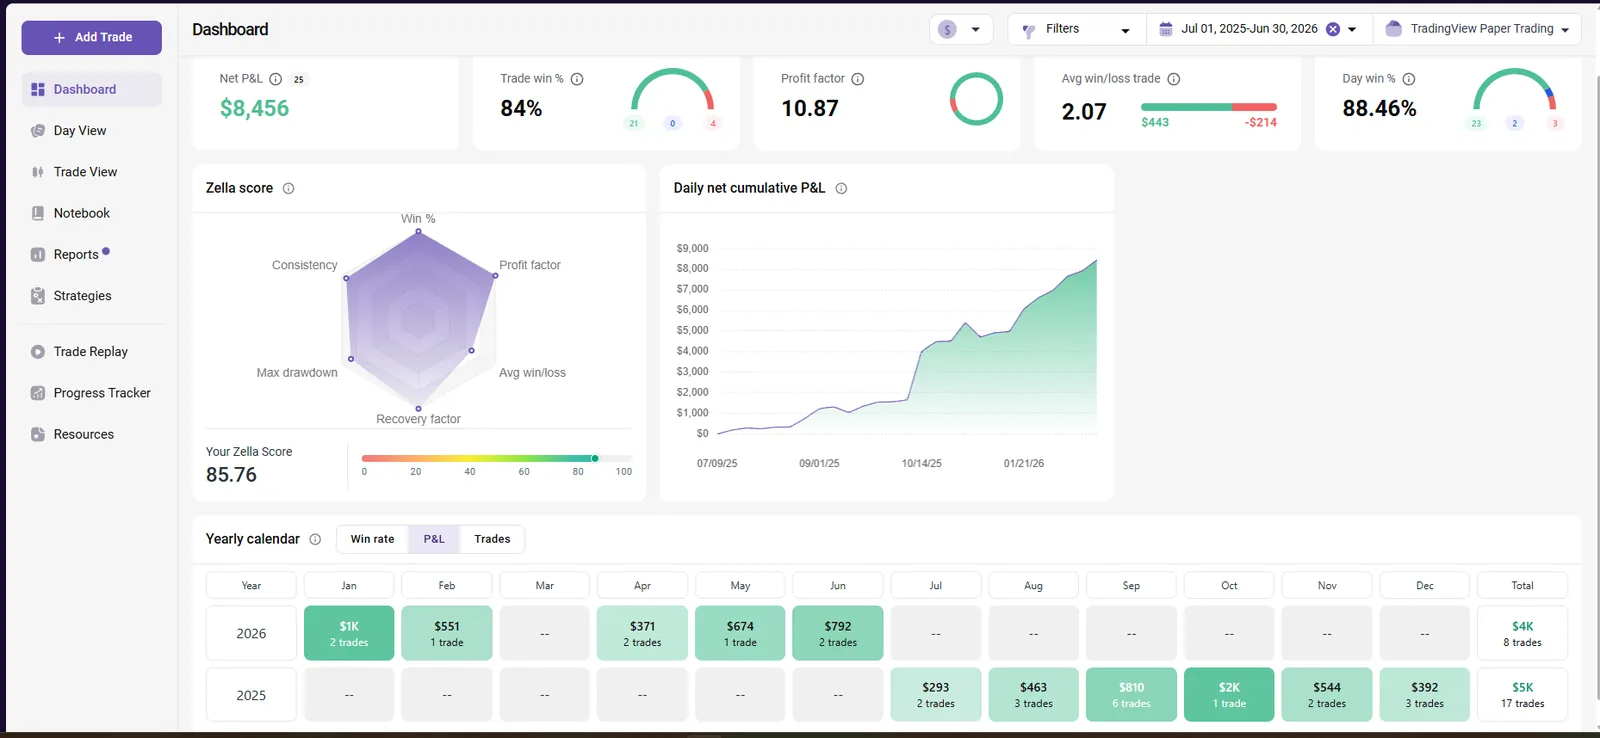
TradingView performance summary · last 4 quarters (Q3'25 — Q2'26)
Quarterly breakdown
| Quarter | Phase | Net | WR | Trades | Max DD (EOD) |
|---|---|---|---|---|---|
| Q3'25 | backtest | +$1,566 | 82.8% | 29 | $318 |
| Q4'25 | backtest | +$3,353 | 81.2% | 16 | $657 |
| Q1'26 | backtest | +$1,700 | 85.7% | 7 | $0 |
| Q2'26 live | live | +$1,837 | 100.0% | 12 | $0 |
Warm-up: strategy builds HTF levels ~3 months — Q2 2025 carries no trades by design. Drawdowns are EOD basis; intrabar peak-to-trough runs higher.
Stats · backtest
| Avg win / loss | W:L | Largest win / loss | Max DD EOD | Sharpe | Sortino | Calmar | Avg bars |
|---|---|---|---|---|---|---|---|
| $179 / $120 | 1.49 | $1,743 / $537 | $657 (0.66%) | 2.13 (3.81 live) | 1.29 | 9.73 | 81.0 |
Account sizing · Monte Carlo 1,500 paths × 3y
| Account | Qty | Blow/y | Net/y P50 [P10–P90] | Median TTP | Status |
|---|---|---|---|---|---|
| 50K FP | excluded at this tier | ||||
| 100K FP | 3 ct | 0.0% | $6,103 [$4,329–$8,154] | 155 d | SAFE |
| 150K FP | 3 ct | 0.0% | $6,103 [$4,329–$8,154] | 216 d | SAFE |
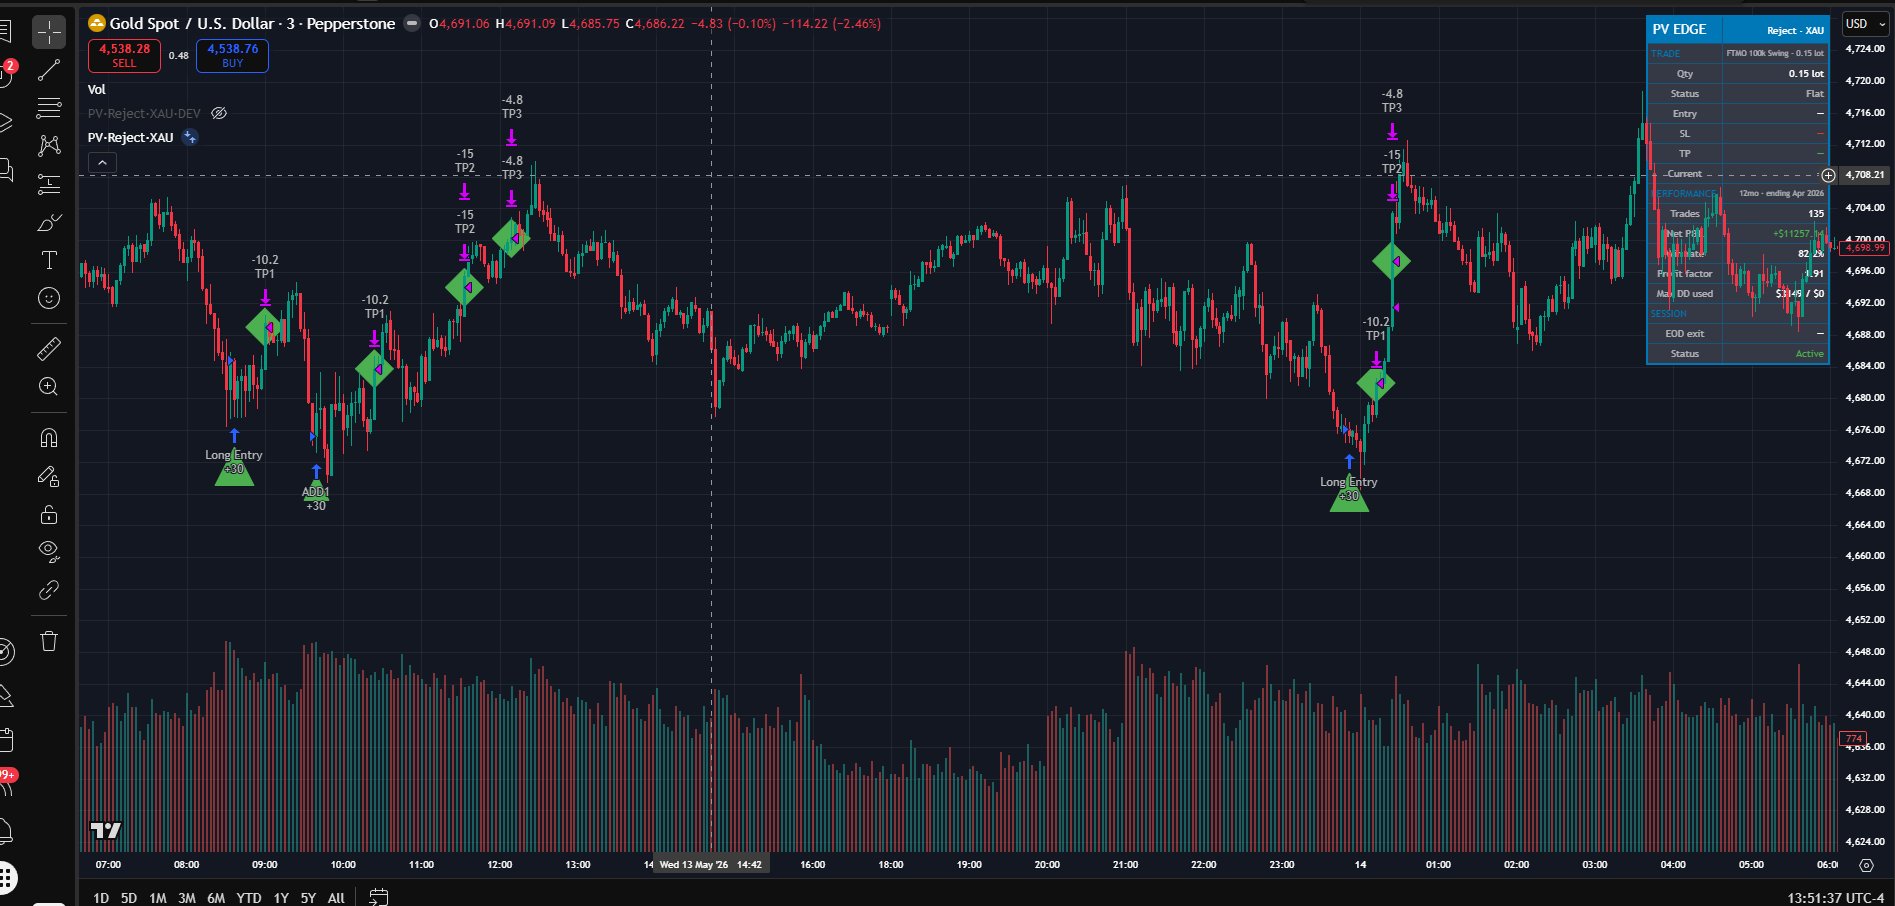
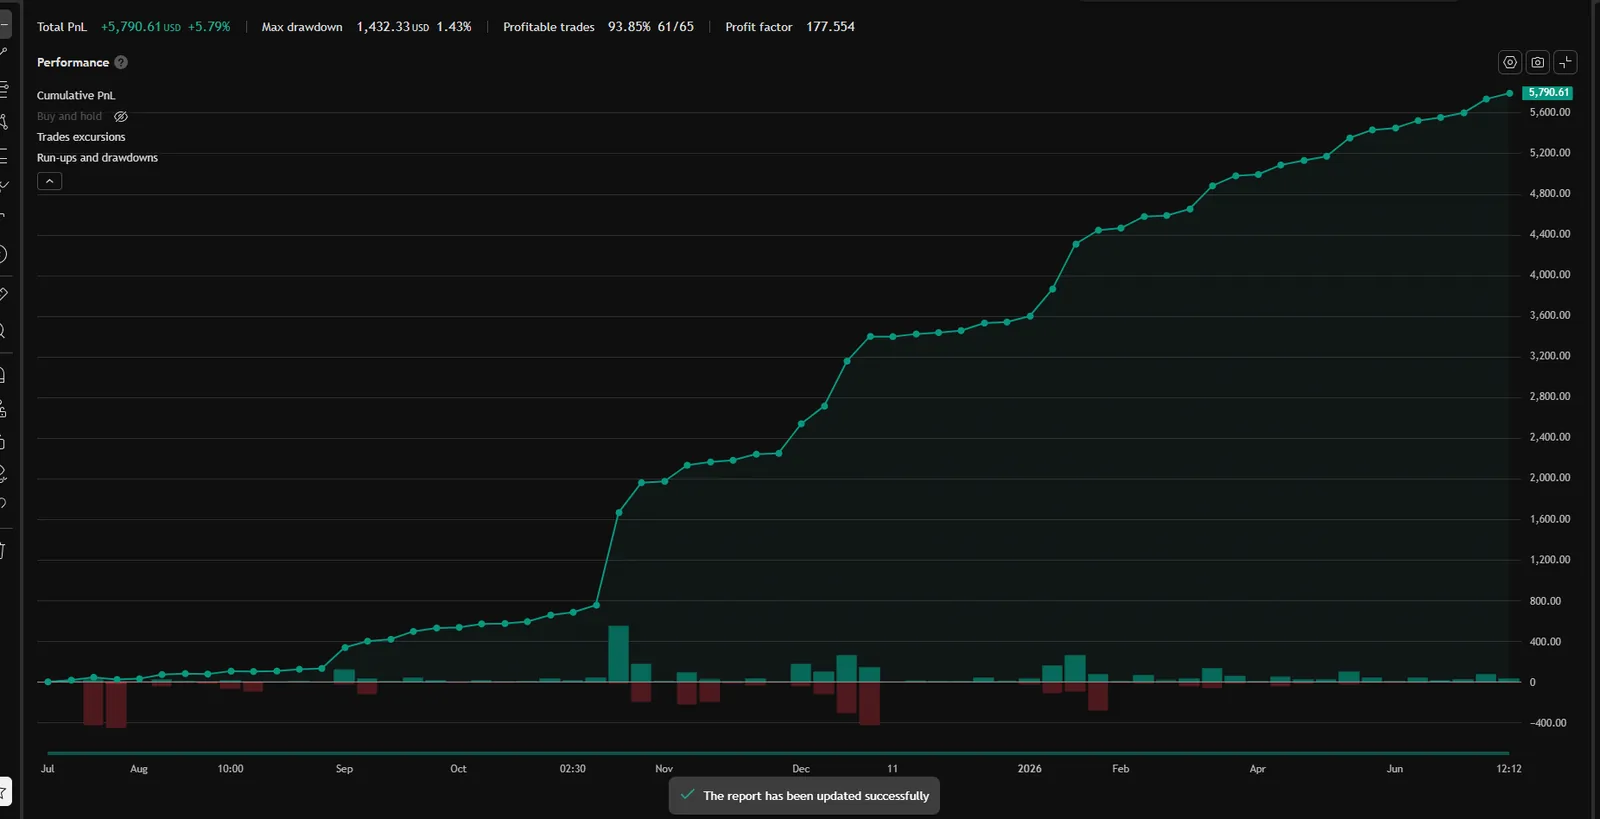
Equity curve · backtest + live
Daily P&L applied to the $100,000 starting balance at the 100K preset (0.15 lot), log scale. Gray = pre-publication (2025-04-01 → 2026-03-31); accent = live (2026-04-01 → 2026-06-30).
TradingView performance summary · last 4 quarters (Q3'25 — Q2'26)
Quarterly breakdown
| Quarter | Phase | Net | WR | Trades | Max DD (EOD) |
|---|---|---|---|---|---|
| Q3'25 | backtest | +$530 | 83.3% | 18 | $0 |
| Q4'25 | backtest | +$3,010 | 96.0% | 25 | $0 |
| Q1'26 | backtest | +$1,438 | 100.0% | 10 | $0 |
| Q2'26 live | live | +$812 | 100.0% | 12 | $0 |
Warm-up: strategy builds HTF levels ~3 months — Q2 2025 carries no trades by design. Drawdowns are EOD basis; intrabar peak-to-trough runs higher.
Stats · backtest
| Avg win / loss | W:L | Largest win / loss | Max DD EOD | Sharpe | Sortino | Calmar | Avg bars |
|---|---|---|---|---|---|---|---|
| $102 / $8 | 12.47 | $911 / $22 | $0 (0.0%) | 2.82 (3.8 live) | 210.0 |
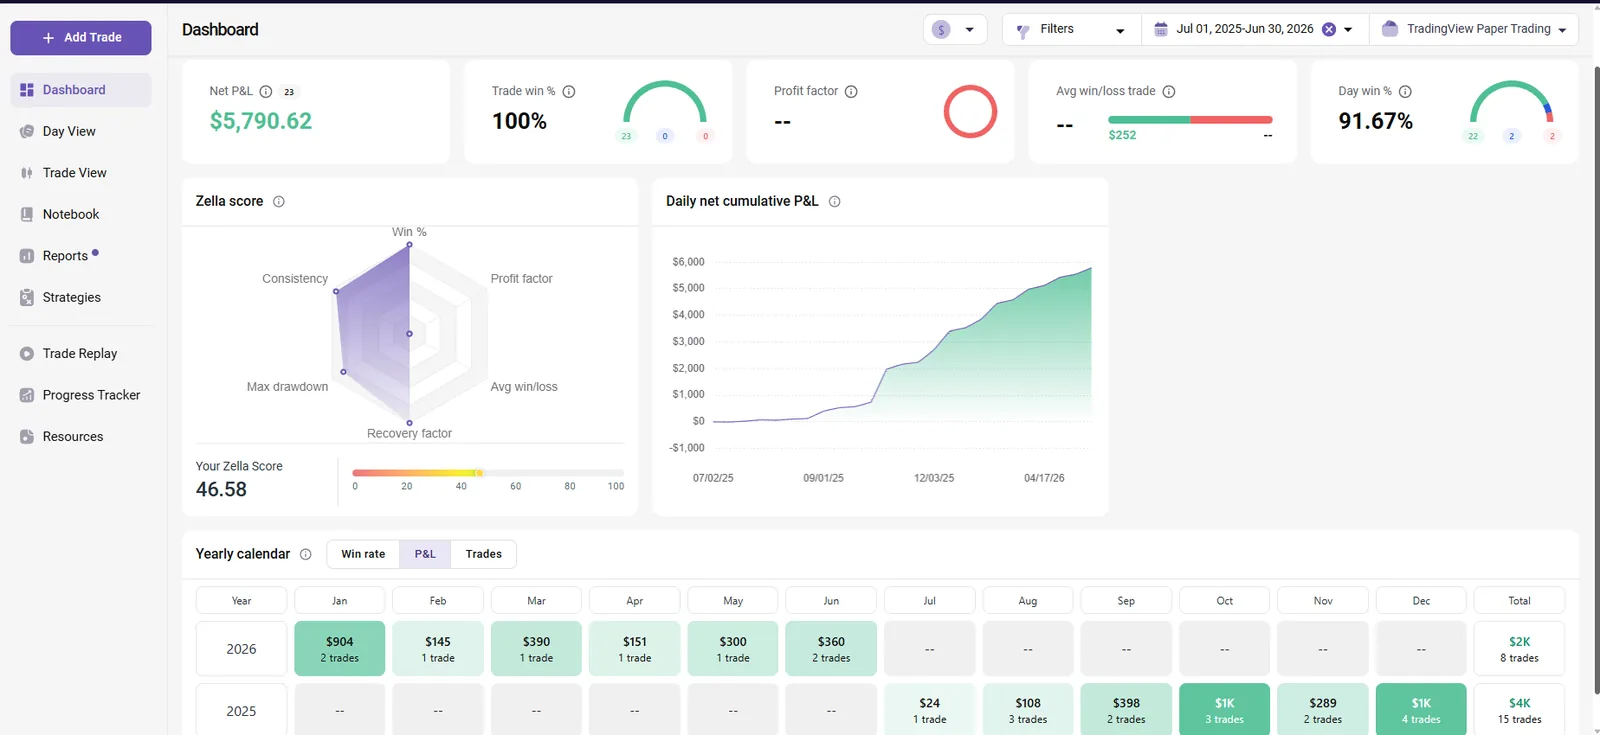
Account sizing · Monte Carlo 1,500 paths × 3y
| Account | Qty | Blow/y | Net/y P50 [P10–P90] | Median TTP | Status |
|---|---|---|---|---|---|
| 50K Swing | excluded at this tier | ||||
| 100K Swing | 0.15 lot | 0.0% | $4,307 [$3,259–$5,583] | 122 d | SAFE |
| 200K Swing | 0.3 lot | 0.0% | $8,613 [$6,519–$11,167] | 122 d | SAFE |
Risk disclosure
Backtest Q2'25–Q1'26 plus live Q2'26 at the stated presets. Past performance, simulated or live, does not guarantee future results. Futures and CFD trading involves substantial risk of loss; prop-firm accounts add breach rules (daily/EOD drawdown) that can terminate an account regardless of long-term edge. Size accordingly.
How Reject works
Reject enters on rejection wicks: a candle that pushes through a key level and immediately closes back inside, signaling a failed breakout. The strategy fades the rejection in the opposite direction, targeting the next liquidity zone for exit.
MGC 50K and 100K are excluded from this strategy. The minimum viable size produces stops too wide for the tighter daily-loss limits on those account tiers. Reject MGC is only available on the 150K Futures Prop account.
The 150K MGC variant has a 62.8%/y blow rate — well above the 15% SAFE threshold. It is published in the sizing table for transparency but should be operated with full awareness of the risk profile. Pass:Blow ratio is 0.9:1, meaning roughly equal odds of pass and blow over the 3-year simulation horizon. The compensation: BEST/y reaches $36,337 (P90).
XAU Forex Swing is the safer Reject variant: blow 0.5%/y, viability 99.9%, Pass:Blow 68:1, BEST/y $22,588. The Forex Swing daily-loss buffer absorbs Reject's volatility much better than tight futures daily limits. Most Reject users should start here.
How these numbers were calculated
Trade counts, win rates, profit factors, drawdown values come directly from TradingView Strategy Tester for the baseline preset. Verify by running the strategy in your own TradingView after purchase — numbers match 1:1.
DD%, SL%, Pass:Blow ratio and percentile breakdowns are computed from the same trade list using industry-standard methodology. Reproducible in Excel or Python.
Time-to-payout, Pay/y, Net $/y, Blow rate, and Viability come from a 1,500-path Monte Carlo v6 simulation over a 3-year horizon. Block bootstrap (5-day blocks) preserves serial autocorrelation of trade streaks.
Get Reject + 5 more strategies.
Every Puravida Edge plan includes all 7 strategies and ongoing updates. Founders pricing: limited early-supporter Lifetime spots at 30% off.