Zone
Triple-Zone Pullback
Zone is a pullback-continuation system that trades only where several independent context layers line up in the same place: price has to return into the confluence area and the reaction has to confirm before the strategy commits, and setups that miss any condition are skipped entirely. Trailing 12 months (Sep 2025 – Aug 2026): best PF 3.49 (XAU), combined +$57,565 · live since Q2'26 +$20,488 at 100K presets.
At a glance
Best-performing instrument per metric (max 3 from one instrument). Rolling last 12 months at 100K preset; forecast metrics from 1,500-path Monte Carlo, 3-year horizon. Viability 3y = % of MC paths that never hit the hard drawdown. Payouts : blow = payouts per one account blow over 3y. TTP = median days to first payout.
Equity curve · backtest + live
Daily P&L applied to the $100,000 starting balance at the 100K preset (2 ct), log scale. Gray = backtest (2025-04-01 → 2026-03-31); accent = live (2026-04-01 → 2026-08-31).
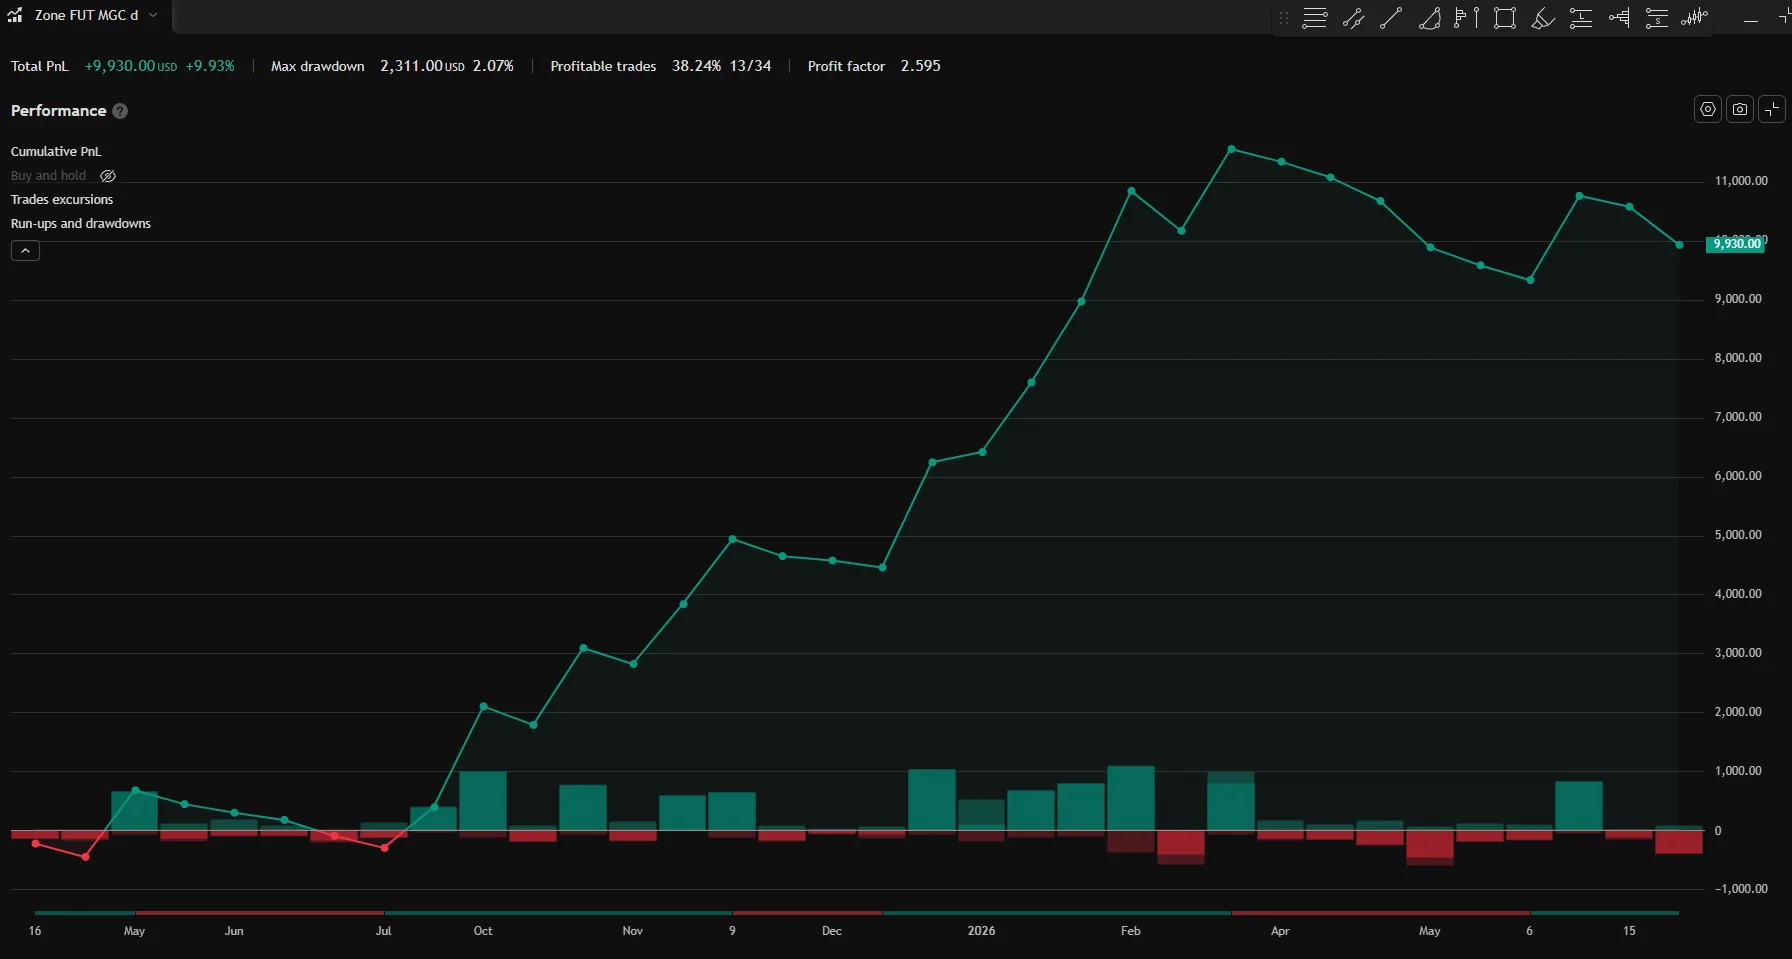
TradingView performance summary · trailing 12 months (Sep 2025 – Aug 2026)
Quarterly breakdown · full history since Q2'25, live since Q2'26
| Quarter | Phase | Net | WR | Trades | Max DD (EOD) |
|---|---|---|---|---|---|
| Q2'25 | backtest | −$94 | 14.3% | 7 | $772 |
| Q3'25 | backtest | +$486 | 50.0% | 2 | $204 |
| Q4'25 | backtest | +$5,850 | 50.0% | 10 | $482 |
| Q1'26 | backtest | +$5,314 | 83.3% | 6 | $676 |
| Q2'26 live | live | −$1,972 | 0.0% | 5 | $1,972 |
| Q3'26 live · 2 mo | live | −$414 | 14.3% | 7 | $1,592 |
Drawdowns are EOD basis; intrabar peak-to-trough runs higher. Q3'26 is accruing (2 of 3 months).
Stats · trailing 12 months
| Avg win / loss | W:L | Largest win / loss | Max DD EOD | Sharpe | Sortino | Calmar | Avg bars |
|---|---|---|---|---|---|---|---|
| $1252 / $-327 | -3.83 | $1,876 / $-786 | $2,386 (2.39%) | 1.92 | 2.94 | 3.97 | 83 |
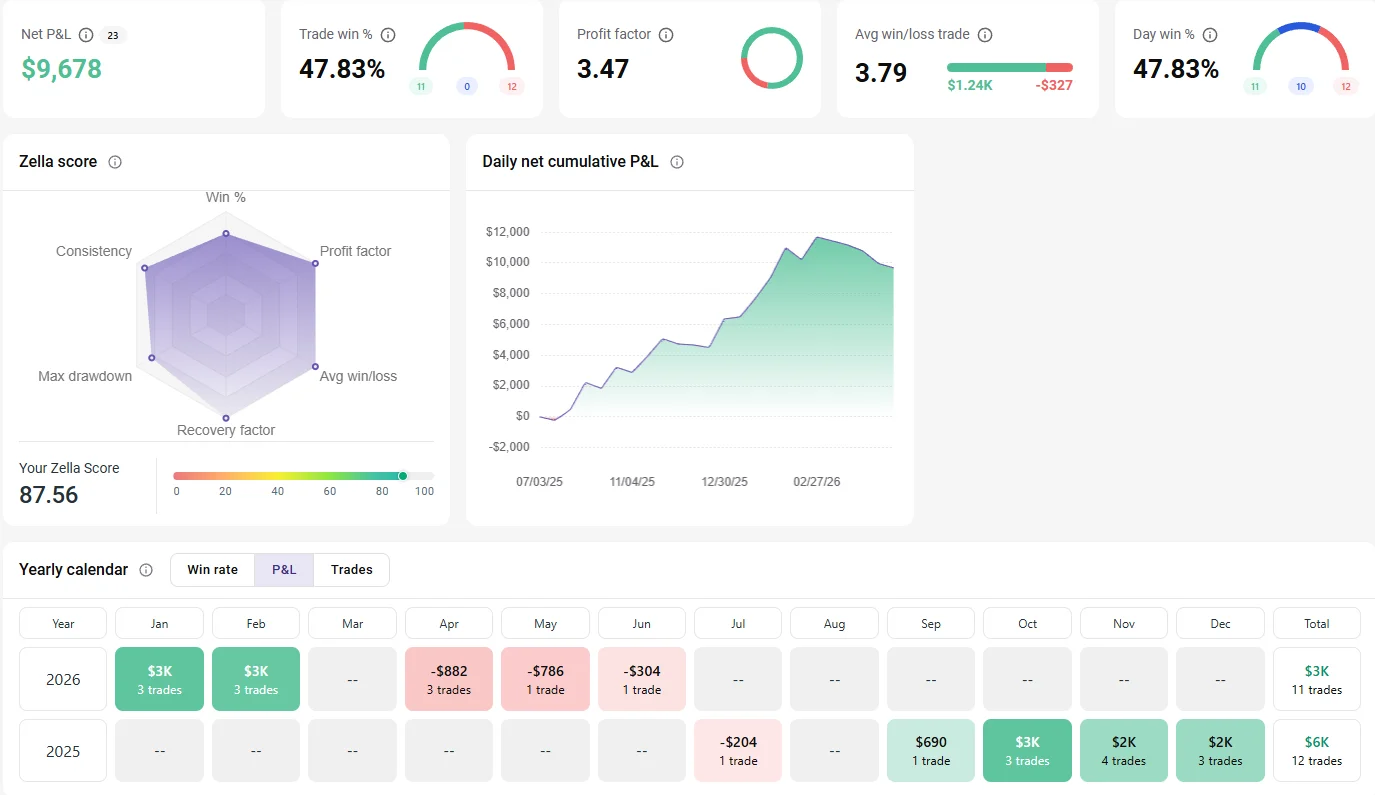
TradeZella merges partial exits into one position, so its trade count runs below the TradingView trade list; net P&L matches to the dollar.
Account sizing · Monte Carlo 1,500 paths × 3y
| Account | Qty | Blow/y | Net/y P50 (MC) | Median TTP | Status |
|---|---|---|---|---|---|
| 50K FP | 1 ct | 0.07% | $2,502 | 212 d | SAFE |
| 100K FP | 2 ct | 0.29% | $5,003 | 212 d | SAFE |
| 150K FP | 3 ct | 0.27% | $7,505 | 212 d | SAFE |
Equity curve · backtest + live
Daily P&L applied to the $100,000 starting balance at the 100K preset (3 ct), log scale. Gray = backtest (2025-04-01 → 2026-03-31); accent = live (2026-04-01 → 2026-08-31).
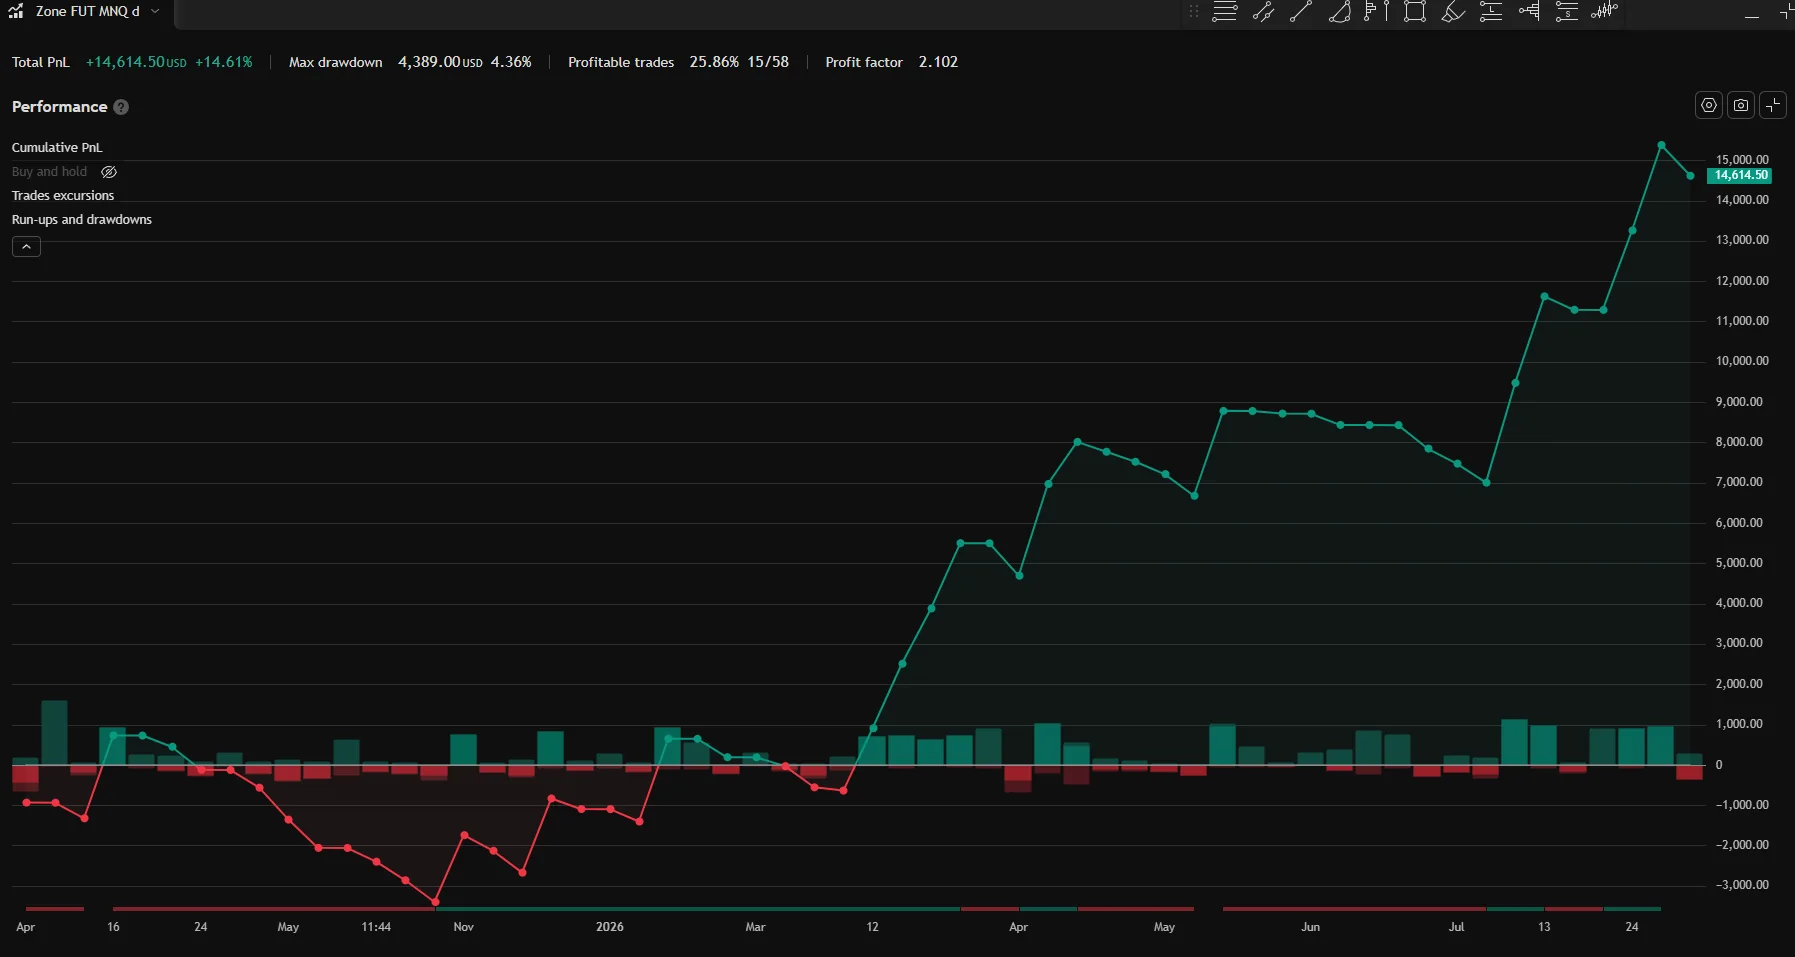
TradingView performance summary · trailing 12 months (Sep 2025 – Aug 2026)
Quarterly breakdown · full history since Q2'25, live since Q2'26
| Quarter | Phase | Net | WR | Trades | Max DD (EOD) |
|---|---|---|---|---|---|
| Q2'25 | backtest | −$2,058 | 9.1% | 11 | $2,788 |
| Q3'25 | backtest | +$0 | — | 0 | $0 |
| Q4'25 | backtest | +$963 | 22.2% | 9 | $1,344 |
| Q1'26 | backtest | +$6,592 | 35.7% | 14 | $1,287 |
| Q2'26 live | live | +$2,349 | 20.0% | 15 | $1,336 |
| Q3'26 live · 2 mo | live | +$7,419 | 38.5% | 13 | $1,992 |
Drawdowns are EOD basis; intrabar peak-to-trough runs higher. Q3'26 is accruing (2 of 3 months).
Stats · trailing 12 months
| Avg win / loss | W:L | Largest win / loss | Max DD EOD | Sharpe | Sortino | Calmar | Avg bars |
|---|---|---|---|---|---|---|---|
| $1898 / $-310 | -6.12 | $2,643 / $-1,646 | $1,992 (1.99%) | 2.14 | 3.17 | 8.7 | 43.8 |
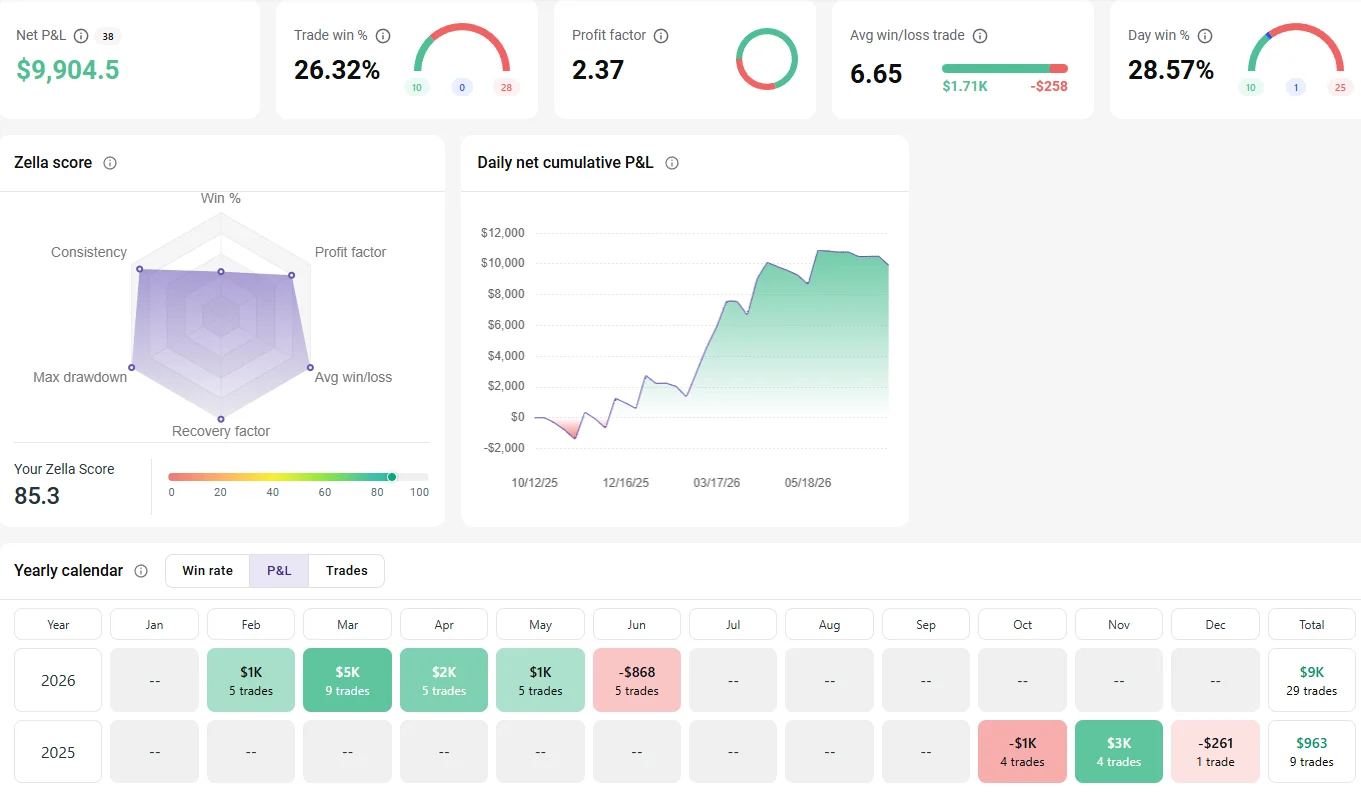
TradeZella merges partial exits into one position, so its trade count runs below the TradingView trade list; net P&L matches to the dollar.
Account sizing · Monte Carlo 1,500 paths × 3y
| Account | Qty | Blow/y | Net/y P50 (MC) | Median TTP | Status |
|---|---|---|---|---|---|
| 50K FP | 2 ct | 4.87% | $3,136 | 145 d | SAFE |
| 100K FP | 3 ct | 4.84% | $4,705 | 192 d | SAFE |
| 150K FP | 5 ct | 5.98% | $7,841 | 171 d | CAUTION |
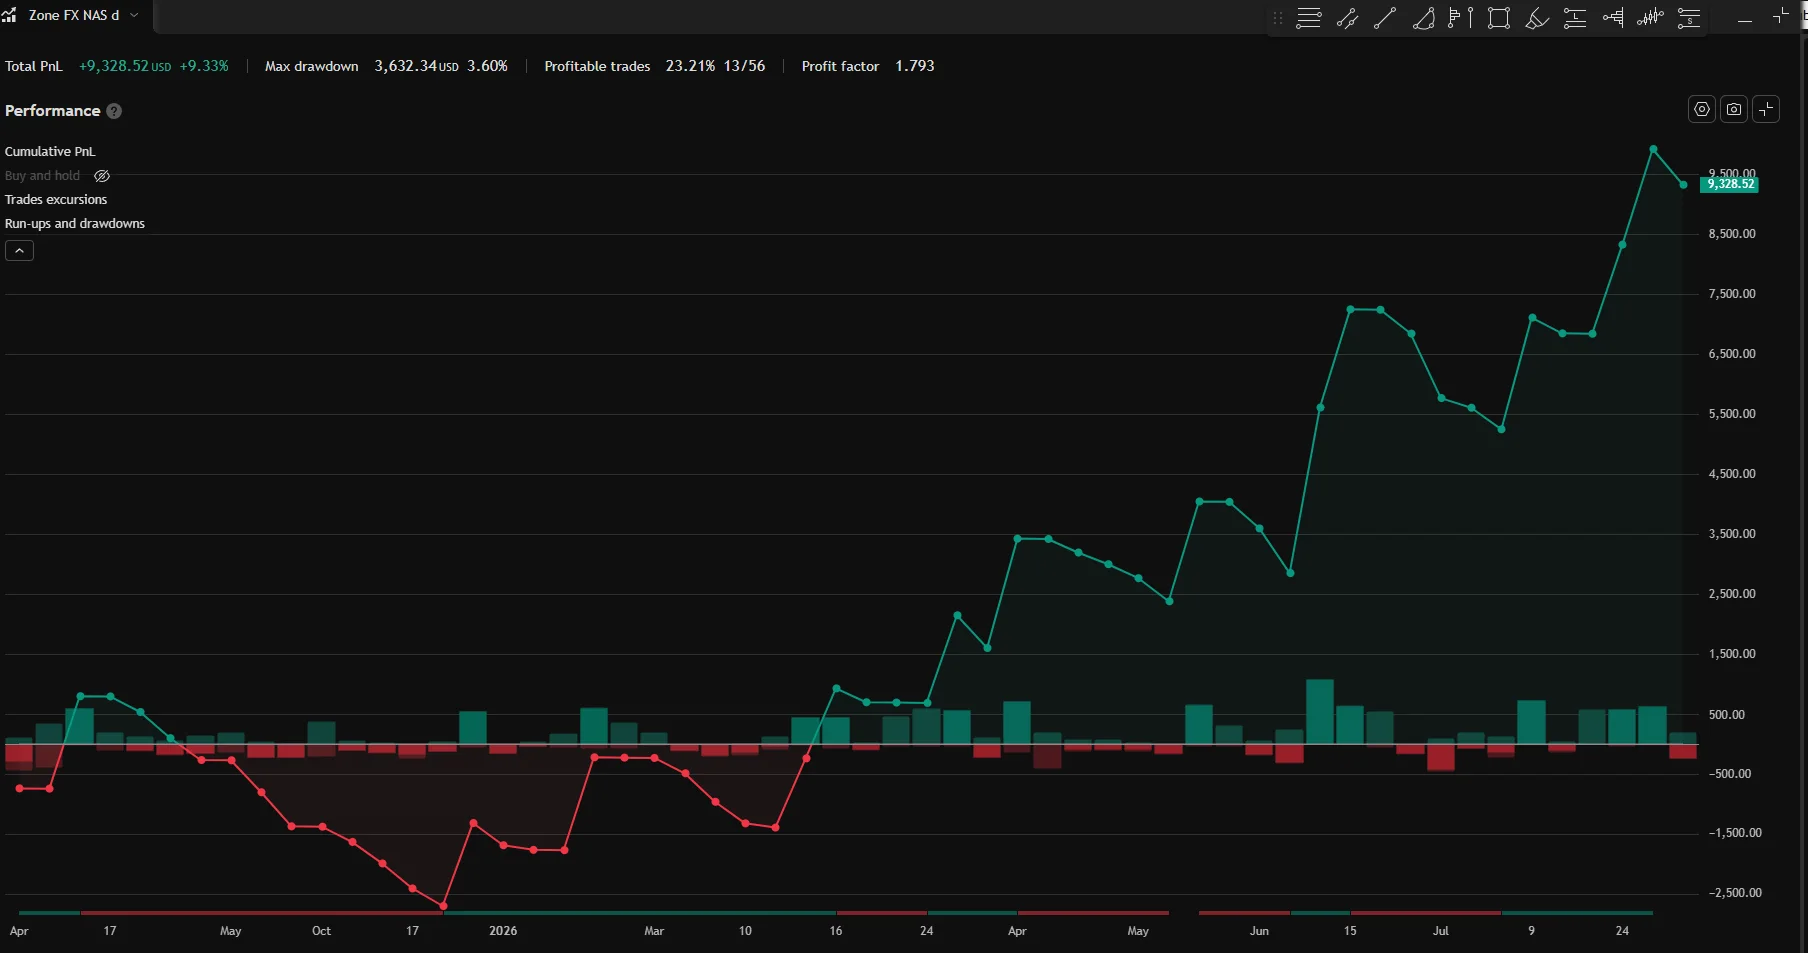
Equity curve · backtest + live
Daily P&L applied to the $100,000 starting balance at the 100K preset (4.6 lot), log scale. Gray = backtest (2025-04-01 → 2026-03-31); accent = live (2026-04-01 → 2026-08-31).
TradingView performance summary · trailing 12 months (Sep 2025 – Aug 2026)
Quarterly breakdown · full history since Q2'25, live since Q2'26
| Quarter | Phase | Net | WR | Trades | Max DD (EOD) |
|---|---|---|---|---|---|
| Q2'25 | backtest | −$805 | 11.1% | 9 | $1,603 |
| Q3'25 | backtest | −$568 | 0.0% | 1 | $568 |
| Q4'25 | backtest | +$55 | 16.7% | 6 | $1,329 |
| Q1'26 | backtest | +$2,920 | 23.5% | 17 | $1,172 |
| Q2'26 live | live | +$5,245 | 28.6% | 14 | $1,195 |
| Q3'26 live · 2 mo | live | +$2,221 | 25.0% | 12 | $1,597 |
Drawdowns are EOD basis; intrabar peak-to-trough runs higher. Q3'26 is accruing (2 of 3 months).
Stats · trailing 12 months
| Avg win / loss | W:L | Largest win / loss | Max DD EOD | Sharpe | Sortino | Calmar | Avg bars |
|---|---|---|---|---|---|---|---|
| $1629 / $-246 | -6.62 | $2,763 / $-1,076 | $2,002 (2.00%) | 1.68 | 2.54 | 5.22 | 42.4 |
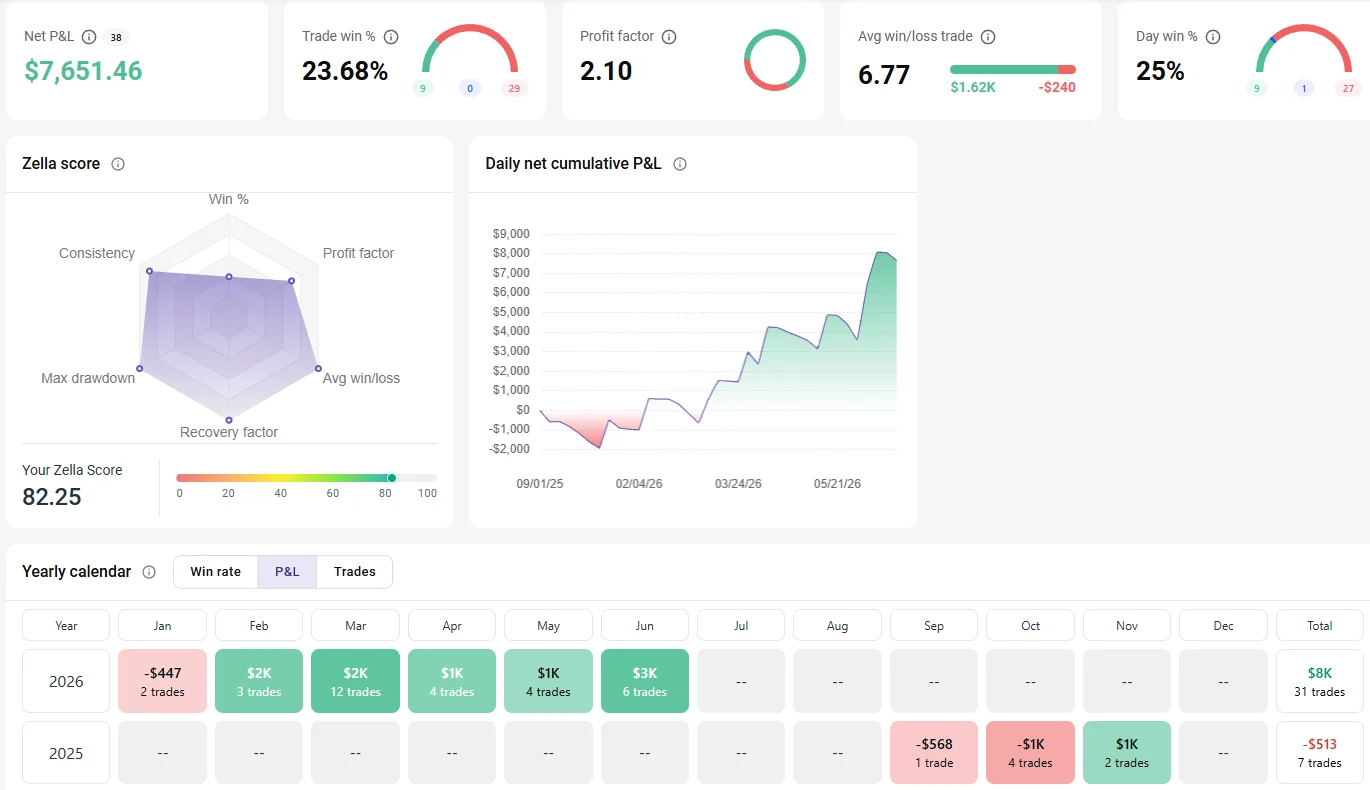
TradeZella merges partial exits into one position, so its trade count runs below the TradingView trade list; net P&L matches to the dollar.
Account sizing · Monte Carlo 1,500 paths × 3y
| Account | Qty | Blow/y | Net/y P50 (MC) | Median TTP | Status |
|---|---|---|---|---|---|
| 50K FP | 2.3 lot | 0.00% | $1,756 | 350 d | SAFE |
| 100K FP | 4.6 lot | 0.00% | $3,511 | 350 d | SAFE |
| 200K FP | 9.2 lot | 0.00% | $7,023 | 350 d | SAFE |
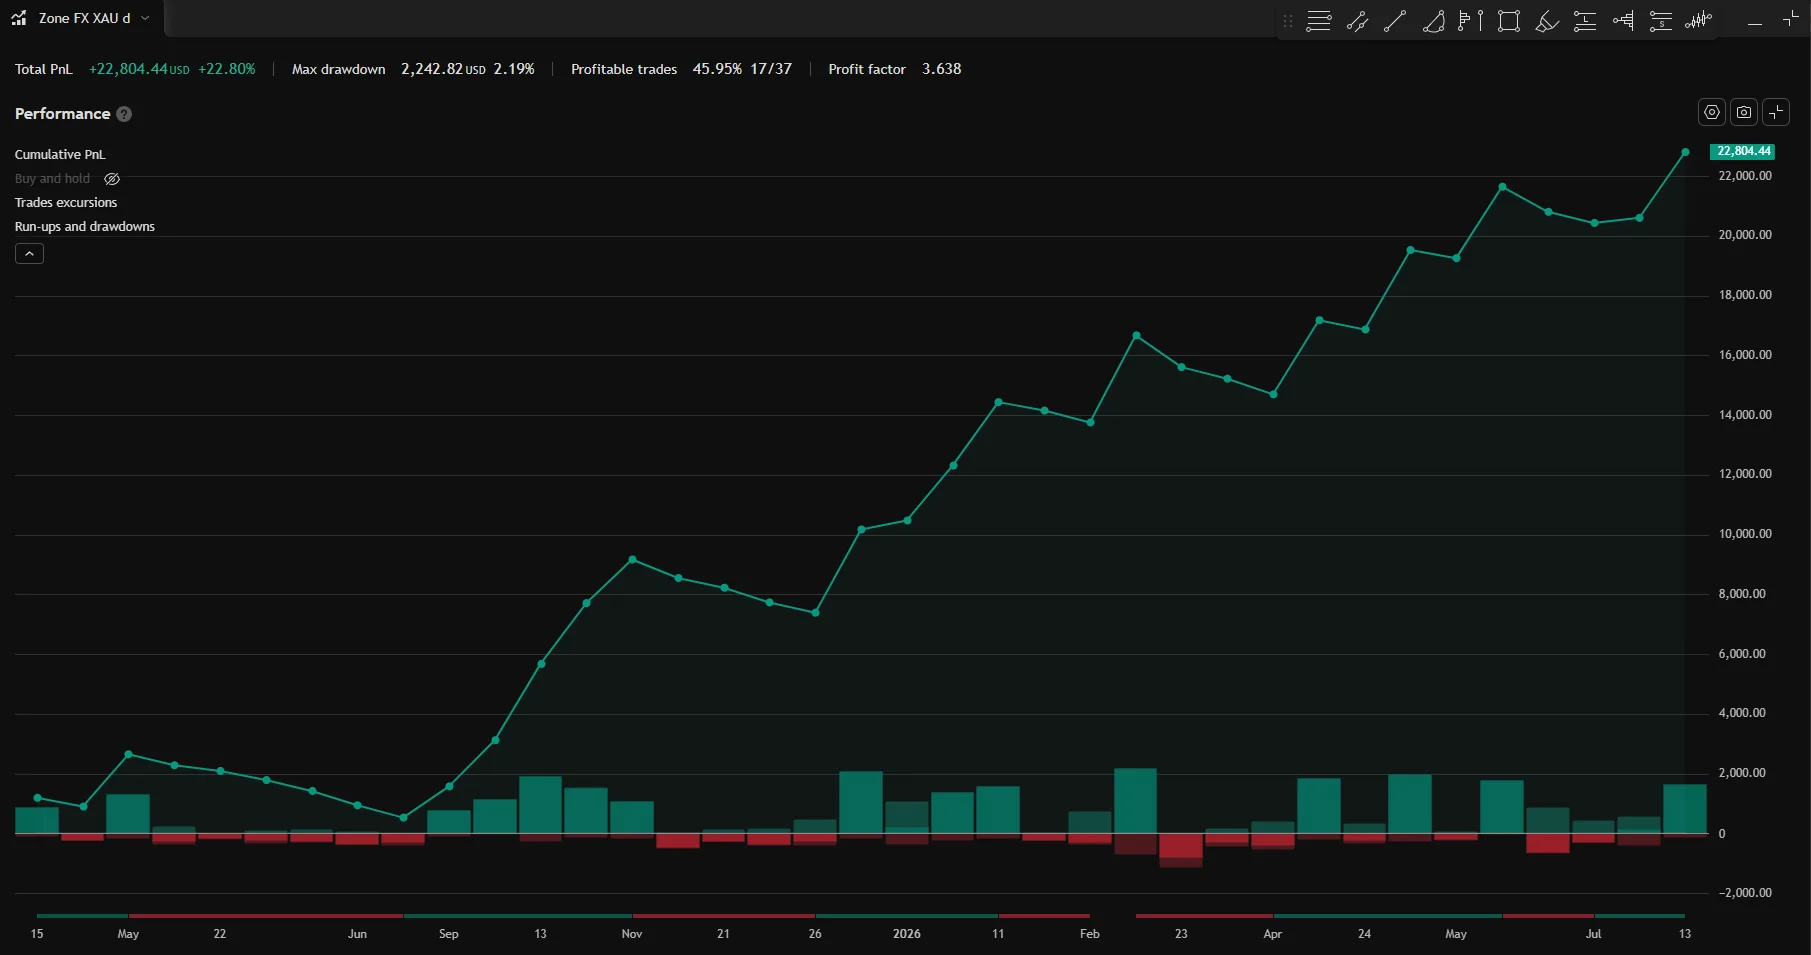
Equity curve · backtest + live
Daily P&L applied to the $100,000 starting balance at the 100K preset (0.32 lot), log scale. Gray = backtest (2025-04-01 → 2026-03-31); accent = live (2026-04-01 → 2026-08-31).
TradingView performance summary · trailing 12 months (Sep 2025 – Aug 2026)
Quarterly breakdown · full history since Q2'25, live since Q2'26
| Quarter | Phase | Net | WR | Trades | Max DD (EOD) |
|---|---|---|---|---|---|
| Q2'25 | backtest | +$526 | 22.2% | 9 | $2,118 |
| Q3'25 | backtest | +$1,046 | 100.0% | 1 | $0 |
| Q4'25 | backtest | +$8,597 | 55.6% | 9 | $1,780 |
| Q1'26 | backtest | +$5,048 | 50.0% | 8 | $1,451 |
| Q2'26 live | live | +$5,586 | 42.9% | 7 | $839 |
| Q3'26 live · 2 mo | live | +$54 | 28.6% | 7 | $1,948 |
Drawdowns are EOD basis; intrabar peak-to-trough runs higher. Q3'26 is accruing (2 of 3 months).
Stats · trailing 12 months
| Avg win / loss | W:L | Largest win / loss | Max DD EOD | Sharpe | Sortino | Calmar | Avg bars |
|---|---|---|---|---|---|---|---|
| $1901 / $-481 | -3.95 | $2,916 / $-1,063 | $1,975 (1.98%) | 2.43 | 5.78 | 10.29 | 74.9 |
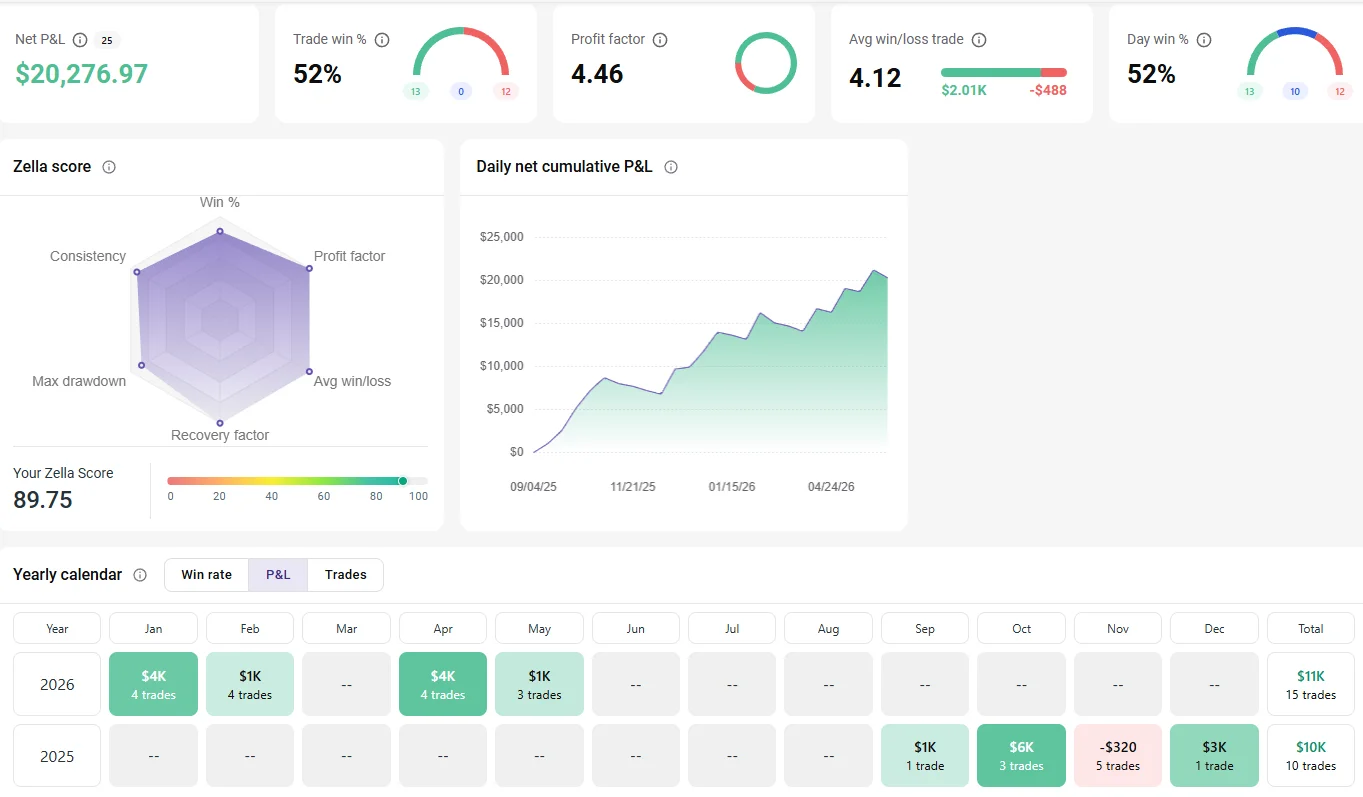
TradeZella merges partial exits into one position, so its trade count runs below the TradingView trade list; net P&L matches to the dollar.
Account sizing · Monte Carlo 1,500 paths × 3y
| Account | Qty | Blow/y | Net/y P50 (MC) | Median TTP | Status |
|---|---|---|---|---|---|
| 50K FP | 0.16 lot | 0.00% | $4,852 | 173 d | SAFE |
| 100K FP | 0.32 lot | 0.00% | $9,704 | 173 d | SAFE |
| 200K FP | 0.64 lot | 0.00% | $19,407 | 173 d | SAFE |
Risk disclosure
Backtest Q2'25–Q1'26 plus live since Q2'26 at the stated presets. Past performance, simulated or live, does not guarantee future results. Futures and CFD trading involves substantial risk of loss; prop-firm accounts add breach rules (daily/EOD drawdown) that can terminate an account regardless of long-term edge. Size accordingly.
How Zone works
Zone is a pullback-continuation system built on confluence. It waits for price to return into an area where several independent context layers overlap, then requires the reaction itself to confirm before entering — a touch alone is not a signal. Any setup that misses part of the condition set is skipped entirely.
Every position is fully pre-defined before entry: protective stop and profit target are set the moment the trade opens. On CFD routing (XAU, NAS) the stop and target travel with the entry order, so the position is protected broker-side even if the alert chain fails afterwards; on futures (MNQ, MGC) exits are managed by TradingView with their own alerts.
The defining trait is selectivity. Zone takes only a limited number of high-confluence setups — typically a few per month on a given instrument — rather than maximizing frequency. That keeps the published sample smaller than usual for a 7-minute timeframe and makes each trade individually meaningful. All four instruments run the same script on M7, with per-instrument parameters, sizing presets and session handling selected automatically.
How these numbers were calculated
Trade counts, win rates, profit factors, drawdown values come directly from TradingView Strategy Tester for the baseline preset. Verify by running the strategy in your own TradingView after purchase — numbers match 1:1.
DD%, SL%, Pass:Blow ratio and percentile breakdowns are computed from the same trade list using industry-standard methodology. Reproducible in Excel or Python.
Time-to-payout, Pay/y, Net $/y, Blow rate, and Viability come from a 1,500-path Monte Carlo v6 simulation over a 3-year horizon. Block bootstrap (5-day blocks) preserves serial autocorrelation of trade streaks.
Get Zone + 8 more strategies.
Every Puravida Edge plan includes all 9 strategies and ongoing updates. Every Lifetime tier can be paid in 12 monthly instalments — full access from the first payment.