Does a trading system trade differently after a loss?
Most traders treat the minute after a stop-out as character. It is better understood as behaviour — and behaviour can be measured.
Data layers: the trade record behind this test spans backtest to 31 March 2026 and live from 1 April 2026, on the same rule sets, at the stated account presets. The permutation test is run on that combined record; the layers are reported separately everywhere results are quoted on this site and are never blended into a single figure. Method at /methodology.
There is a moment every discretionary trader knows and almost nobody logs. The stop gets hit, the position closes, and within a minute you are looking at the chart again — not calmly, not with the checklist you wrote on Sunday, but with a specific kind of urgency. Most traders treat that minute as character. It is better understood as behaviour, and behaviour can be measured.
What the research says about people
In 2005, Joshua Coval and Tyler Shumway published a study in the Journal of Finance using trading records from proprietary traders at the Chicago Board of Trade. These were not beginners on a demo account. They were professionals trading in the pit, with their own capital at risk, with years of experience.
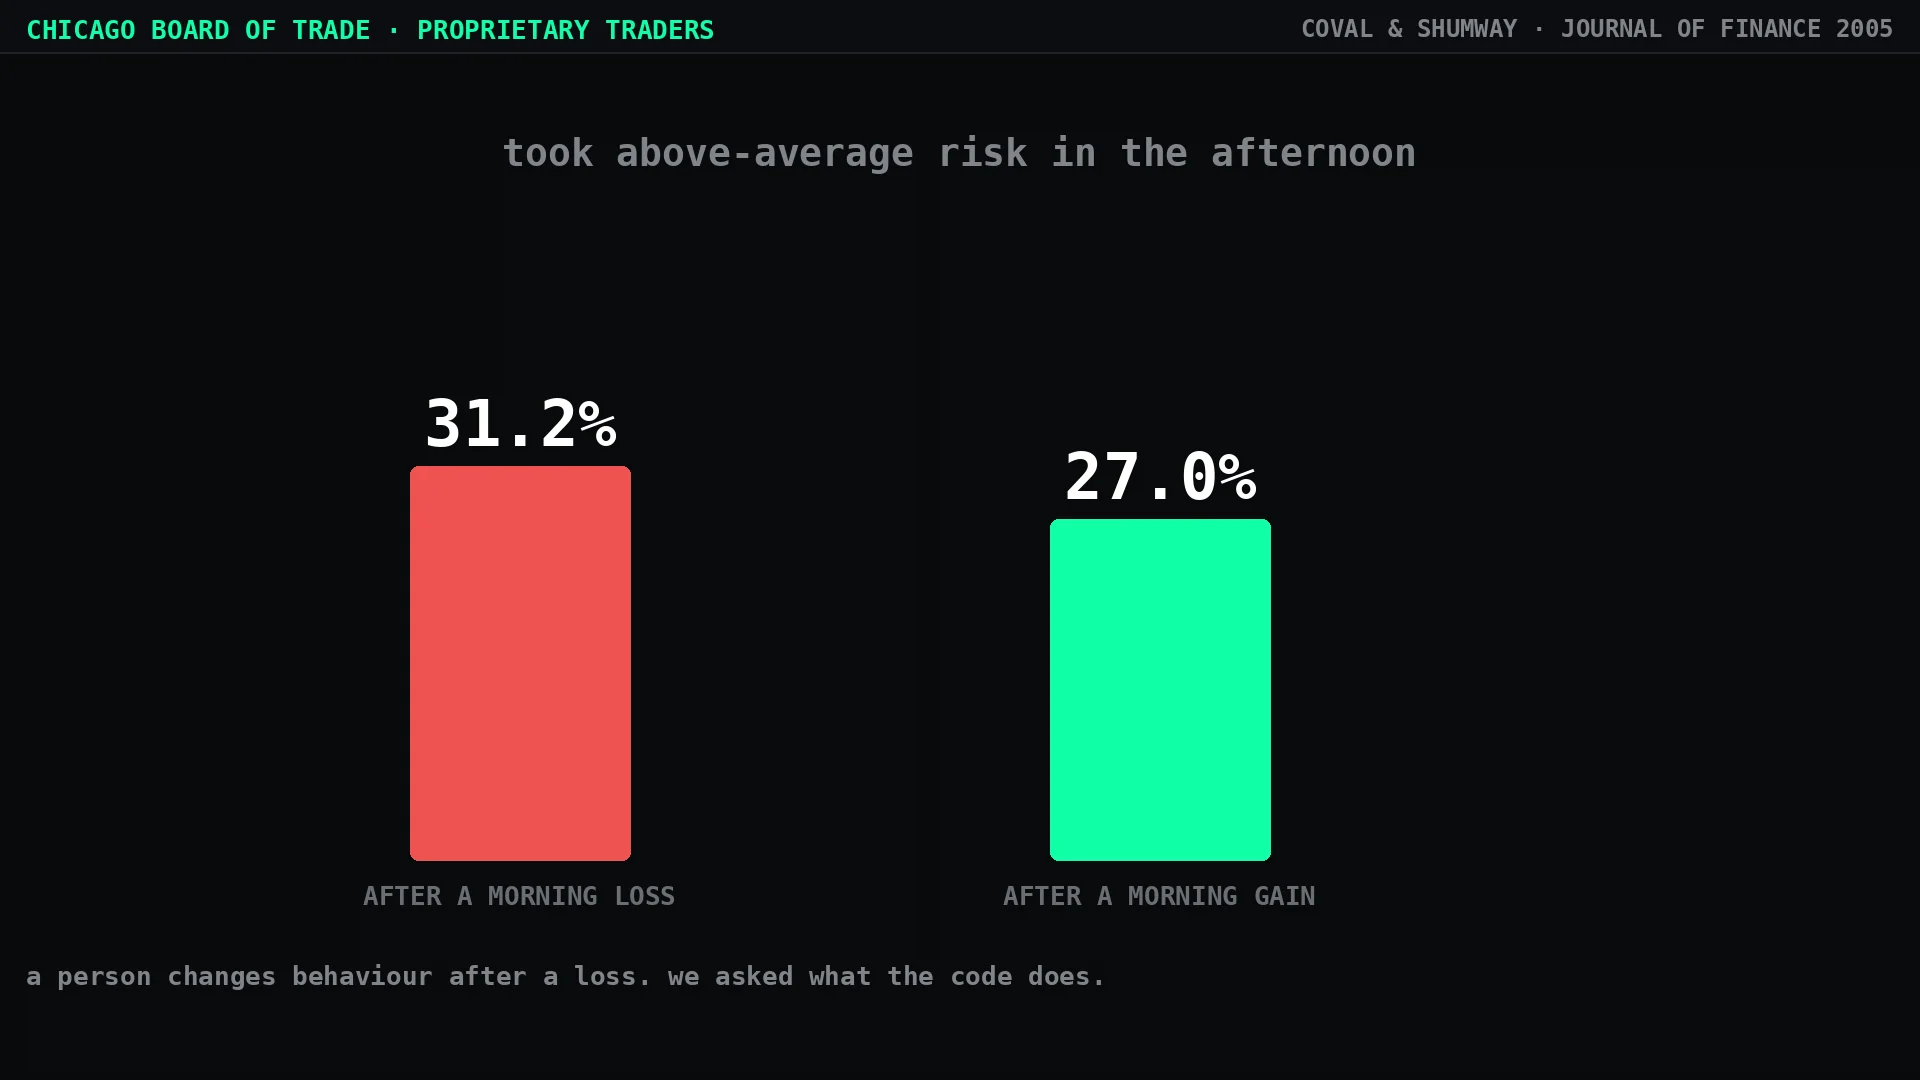
The finding: traders who lost money in the morning were significantly more likely to take above-average risk in the afternoon than traders who had made money in the morning. 31.2% versus 27%. They traded more often, in larger size, and accumulated bigger positions after a loss than after a gain. The pattern has since been replicated on other exchanges, which means it is not a quirk of one trading floor.
Note what the study does not say. It does not say these traders were undisciplined, or that they lacked a plan. It says that after a loss, the risk they were willing to carry went up — and that this happened consistently enough to show in the data across a whole population of professionals.
Why this specific minute matters on a funded account
On a personal account, an oversized revenge trade costs you money. On a funded account, it can cost you the account outright.
Prop accounts come with two constraints that interact badly with this behaviour. The first is a daily loss limit: exceed it and the account is done that day, sometimes permanently. The second is a trailing or static drawdown floor that does not care why the position was oversized. A trader who takes one extra trade at double size twenty minutes after a stop-out is not risking a bad day — they are risking the funding.
Which is why the question is worth asking about any system you intend to run on that kind of account: does it do the same thing?
How we tested it
The test is simple to describe and the definition matters more than the statistics.
For every trade in the catalog, we looked at the trade immediately before it — same strategy version, already closed at the moment the new one opened. That constraint is deliberate: the system could only ever have “seen” a result that was already realised. We tagged each preceding trade as a win or a loss, and then compared what came next along three dimensions: the size of the position, the win rate, and how long the system waited before entering again.
We did not use a fixed time window such as “within 24 hours of a loss.” Strategy versions in the catalog trade between 0.4 and 2.7 times a week; a 24-hour window would have discarded most of the sample for half the catalog. The natural unit for a rule-based system is the next decision, not the next hour.
29 strategy versions had enough observations in both groups to be included.
Result 1 — position size is identical, and not by discipline
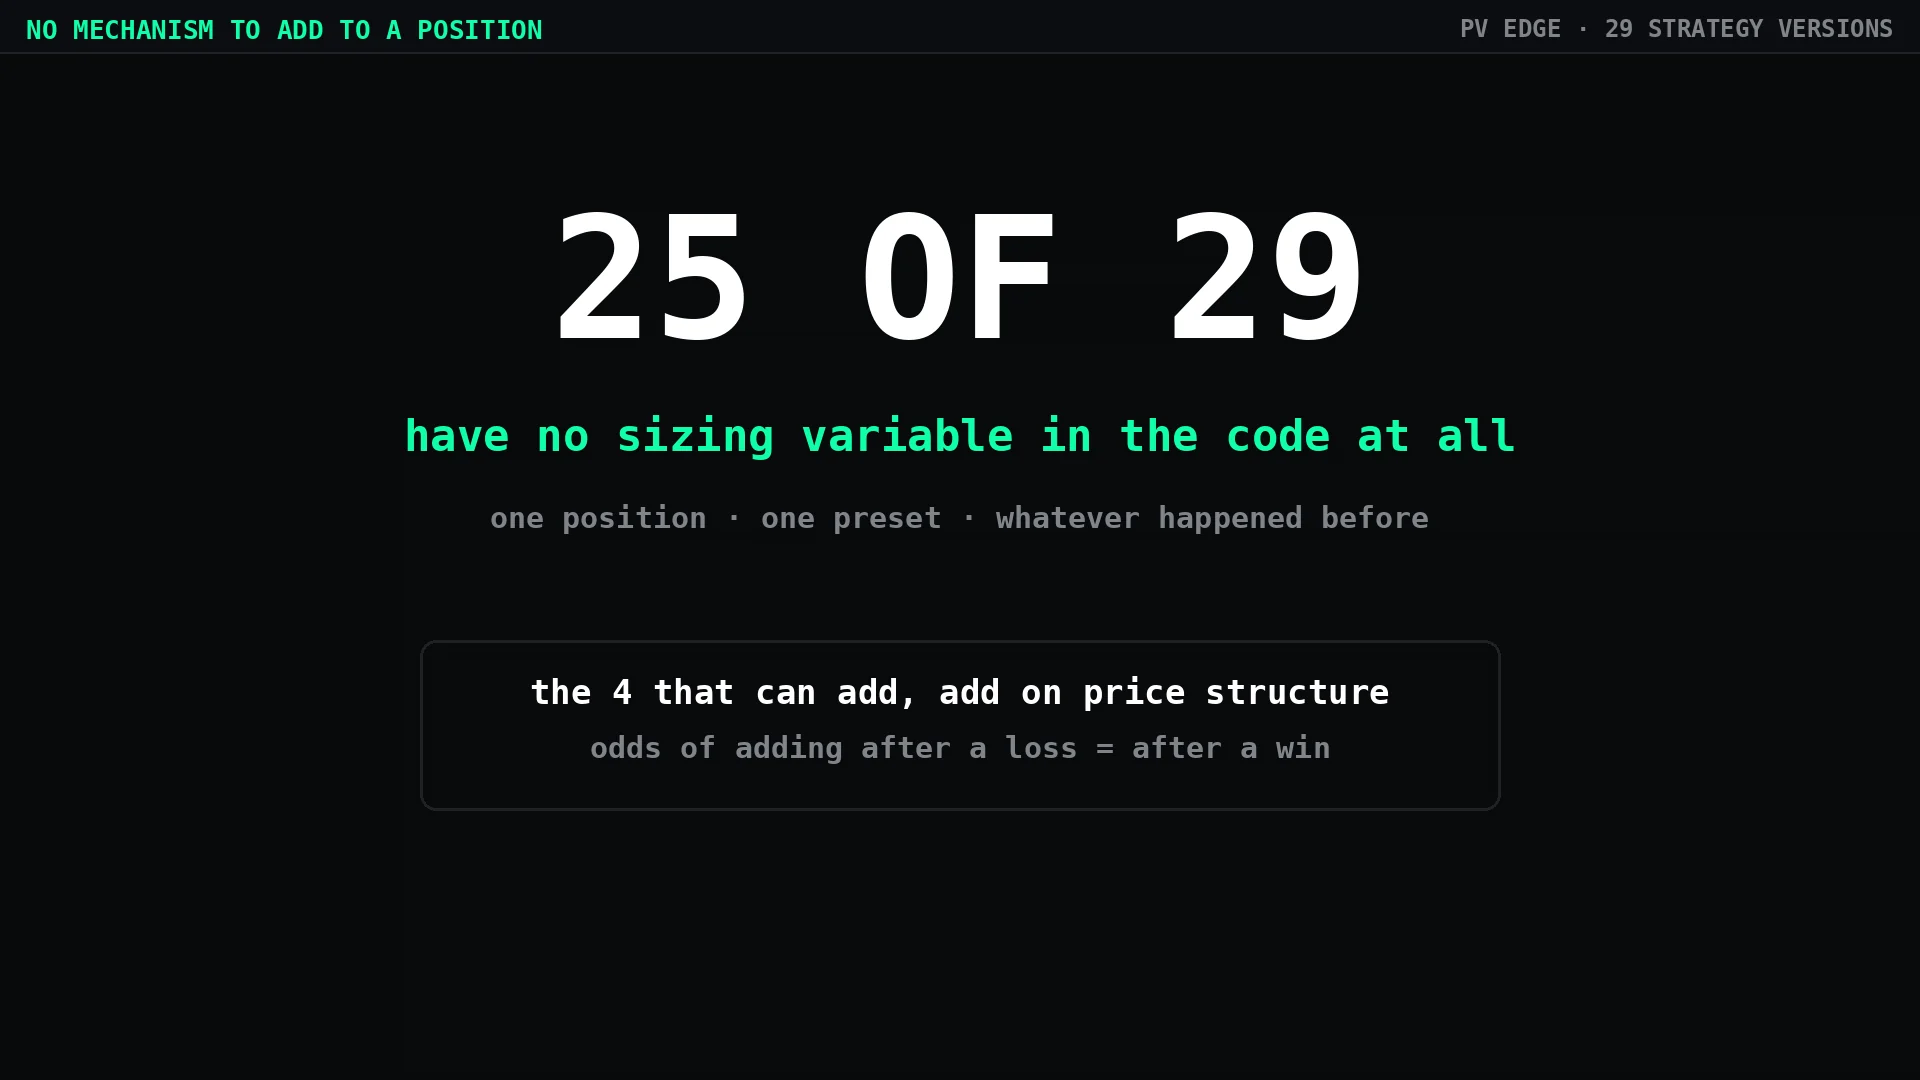
25 of the 29 versions have no mechanism for adding to a position anywhere in the code. One entry, one position, one preset size determined by the account tier. There is no variable that reads the previous result, because there is no variable that changes size at all. After a loss the system cannot size up — not because it resists the urge, but because the capability does not exist.
Four versions can add to a position: they build exposure in stages as a move develops. That is precisely the lever a revenge trader would pull, so we checked it directly — is an add more likely after a loss than after a win? It is not. The probability of adding is statistically indistinguishable between the two groups, and the adds track price structure rather than the last result.
This is the part of the finding we consider strongest, and it is structural rather than statistical. You do not need a p-value to establish that a program cannot do something it has no code path for.
Result 2 — win rate moves by nine tenths of a point
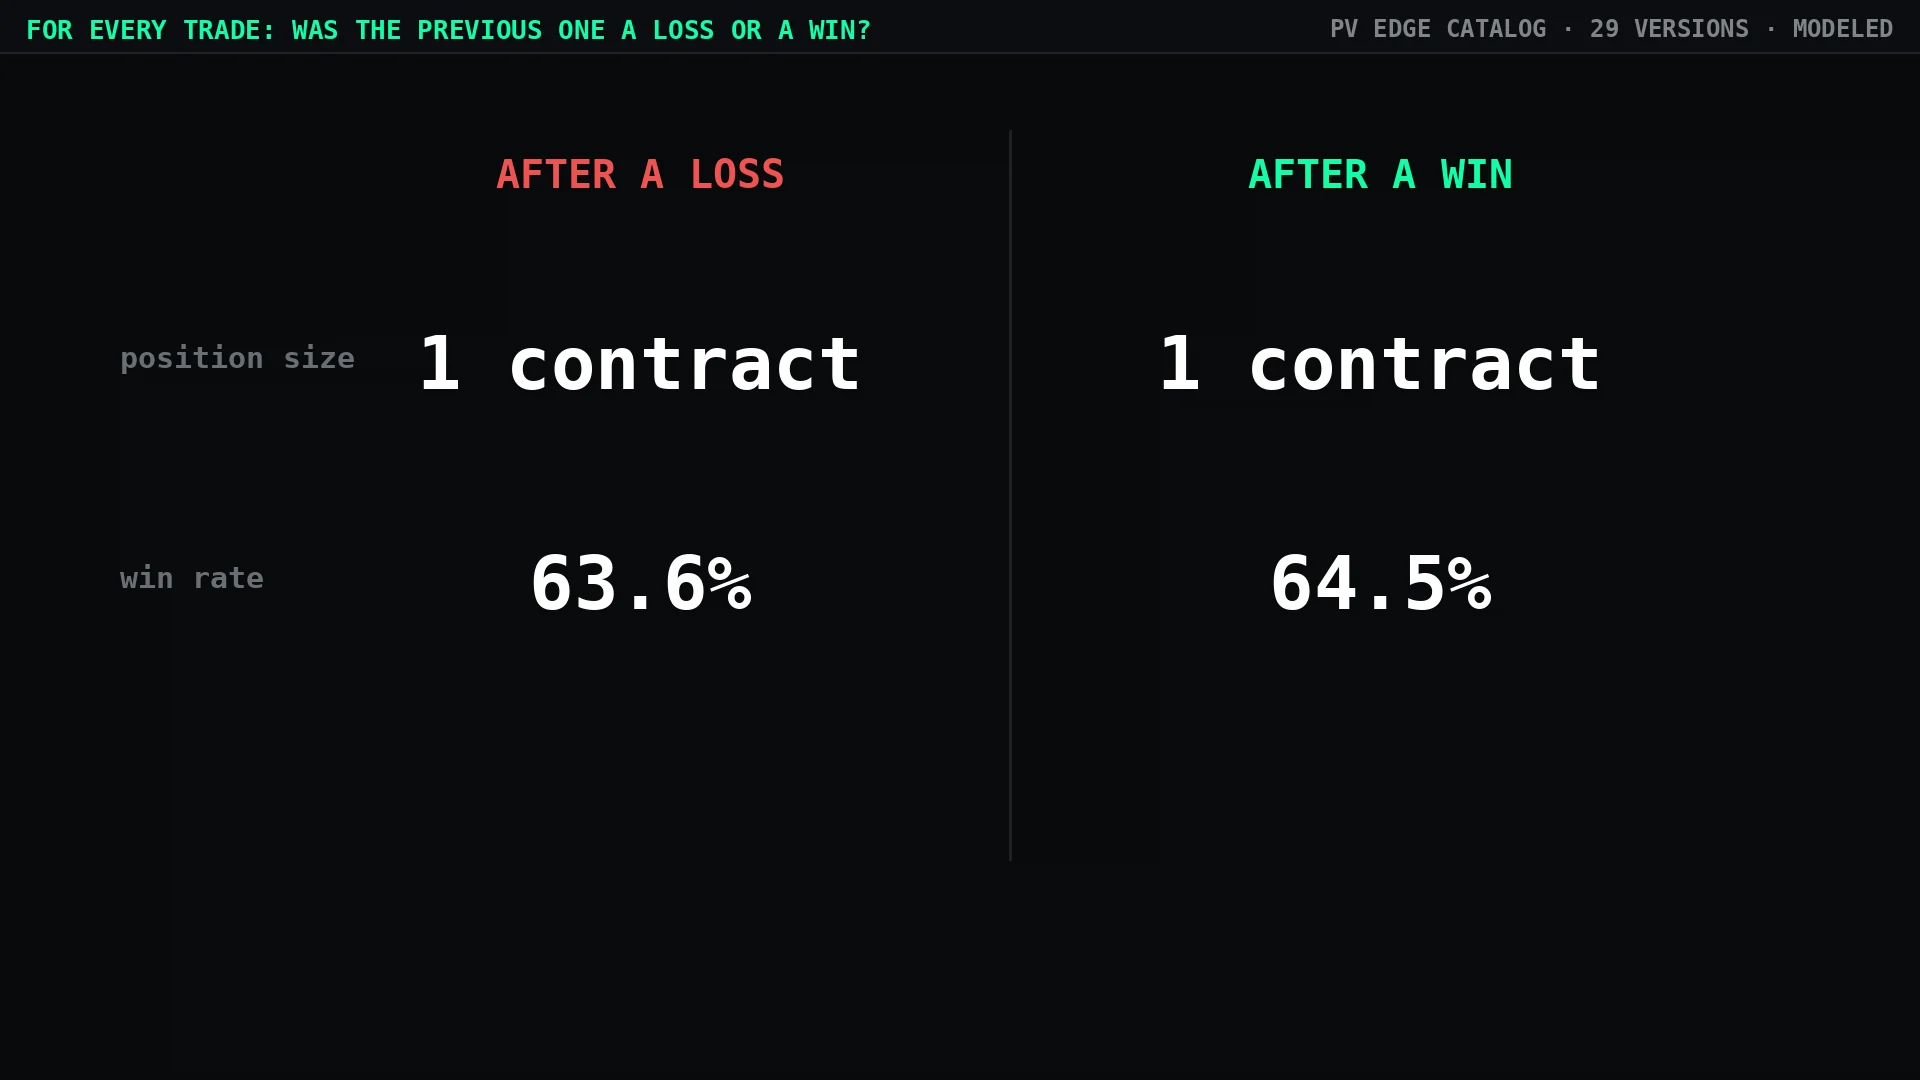
Across the 29 versions, weighted evenly: win rate on trades that followed a loss was 63.6%. On trades that followed a win: 64.5%. A difference of nine tenths of a percentage point, in the direction of slightly worse after a loss.
Expectancy tells the same story: $435 after a loss, $422 after a win — marginally better, which is the opposite direction, and equally meaningless. Both differences sit comfortably inside the range you would expect from random variation, which is exactly what the next test was designed to check.
Result 3 — the real order of trades looks like a shuffled one
“We found no difference” is a weak claim. Noise produces no difference all the time, particularly on samples this size.
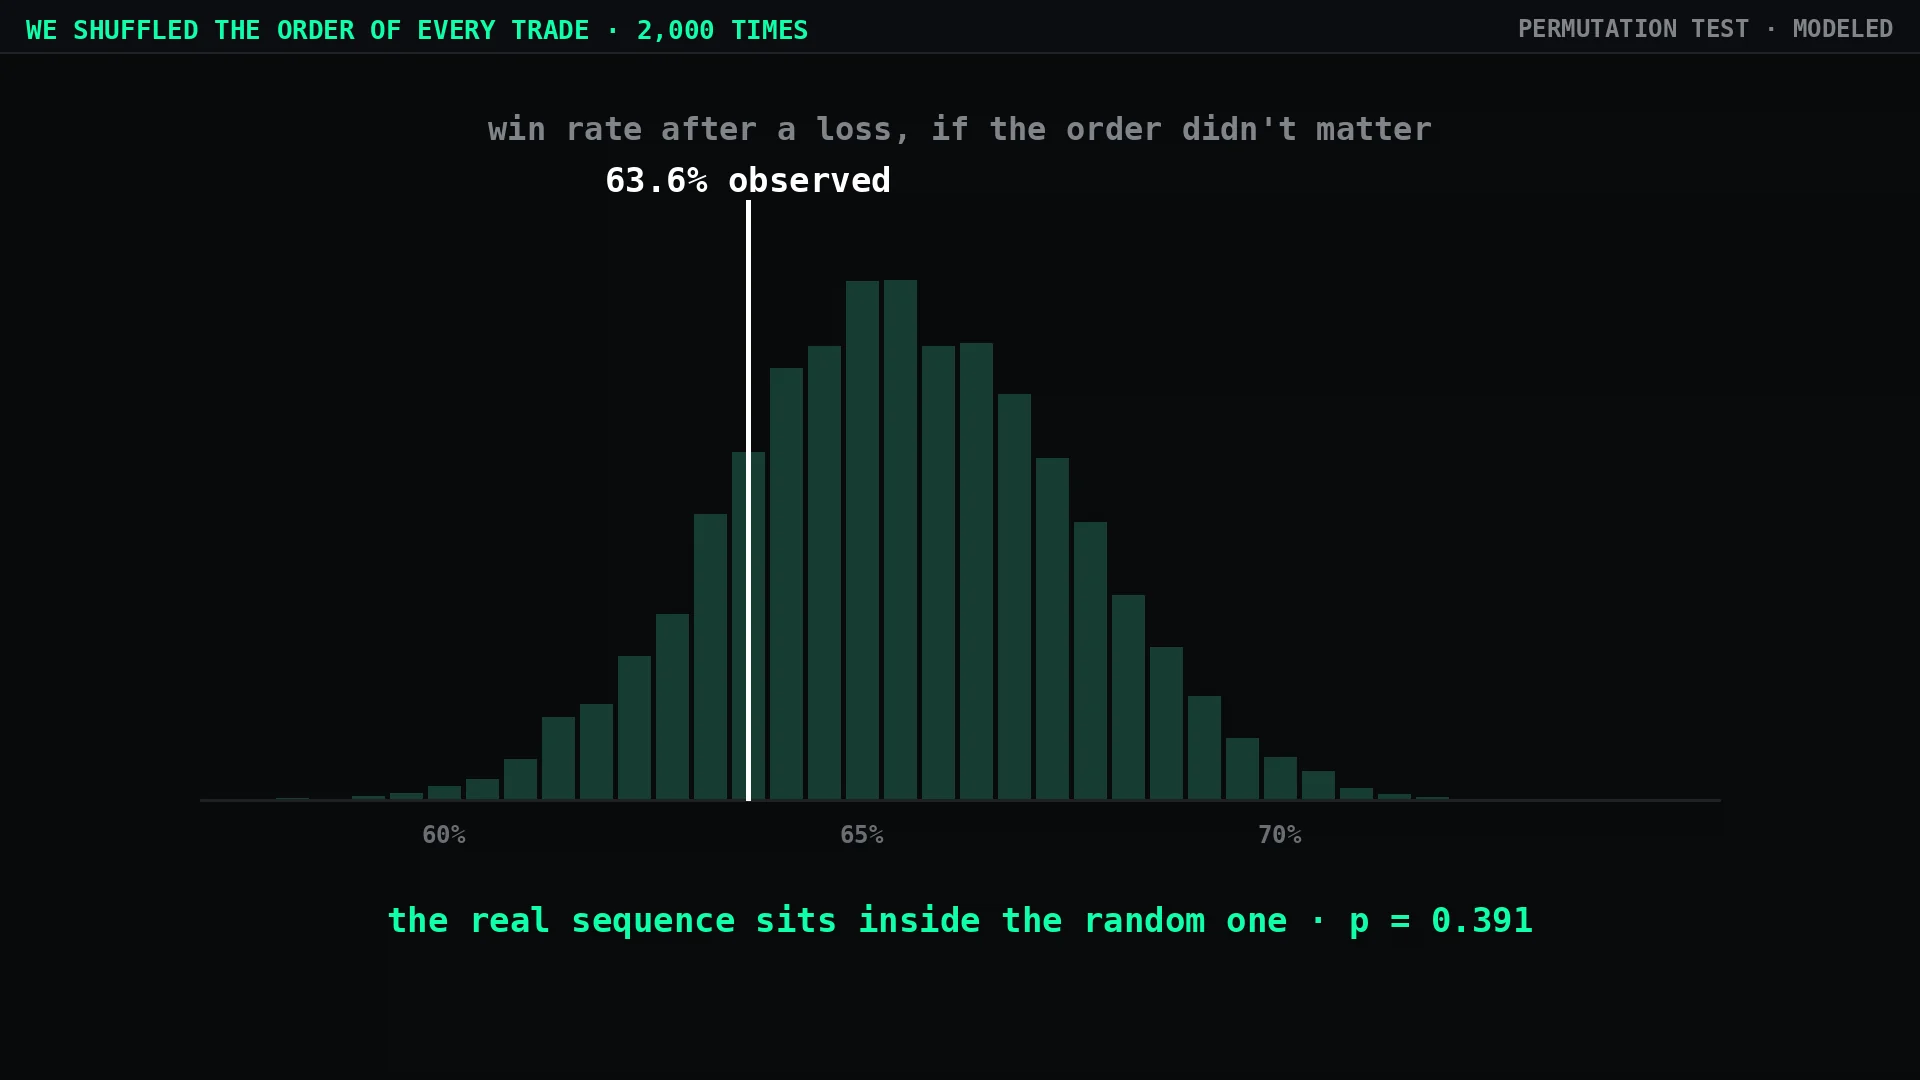
The stronger test is a permutation. We took the sequence of outcomes within each strategy version and shuffled it 2,000 times, keeping the trade timestamps intact and randomising only the order of results. If a system reacted to its last result in any way — larger size, looser entry threshold, faster re-entry — the real sequence would stand apart from the shuffled ones. It did not. The observed post-loss win rate of 63.6% sits in the middle of the random distribution, p = 0.391.
Run individually on each of the 29 versions, not one crossed the conventional significance threshold on win rate.
Result 4 — timing has no direction
The last dimension is the one that maps most directly onto revenge trading: does the system re-enter faster after a loss?
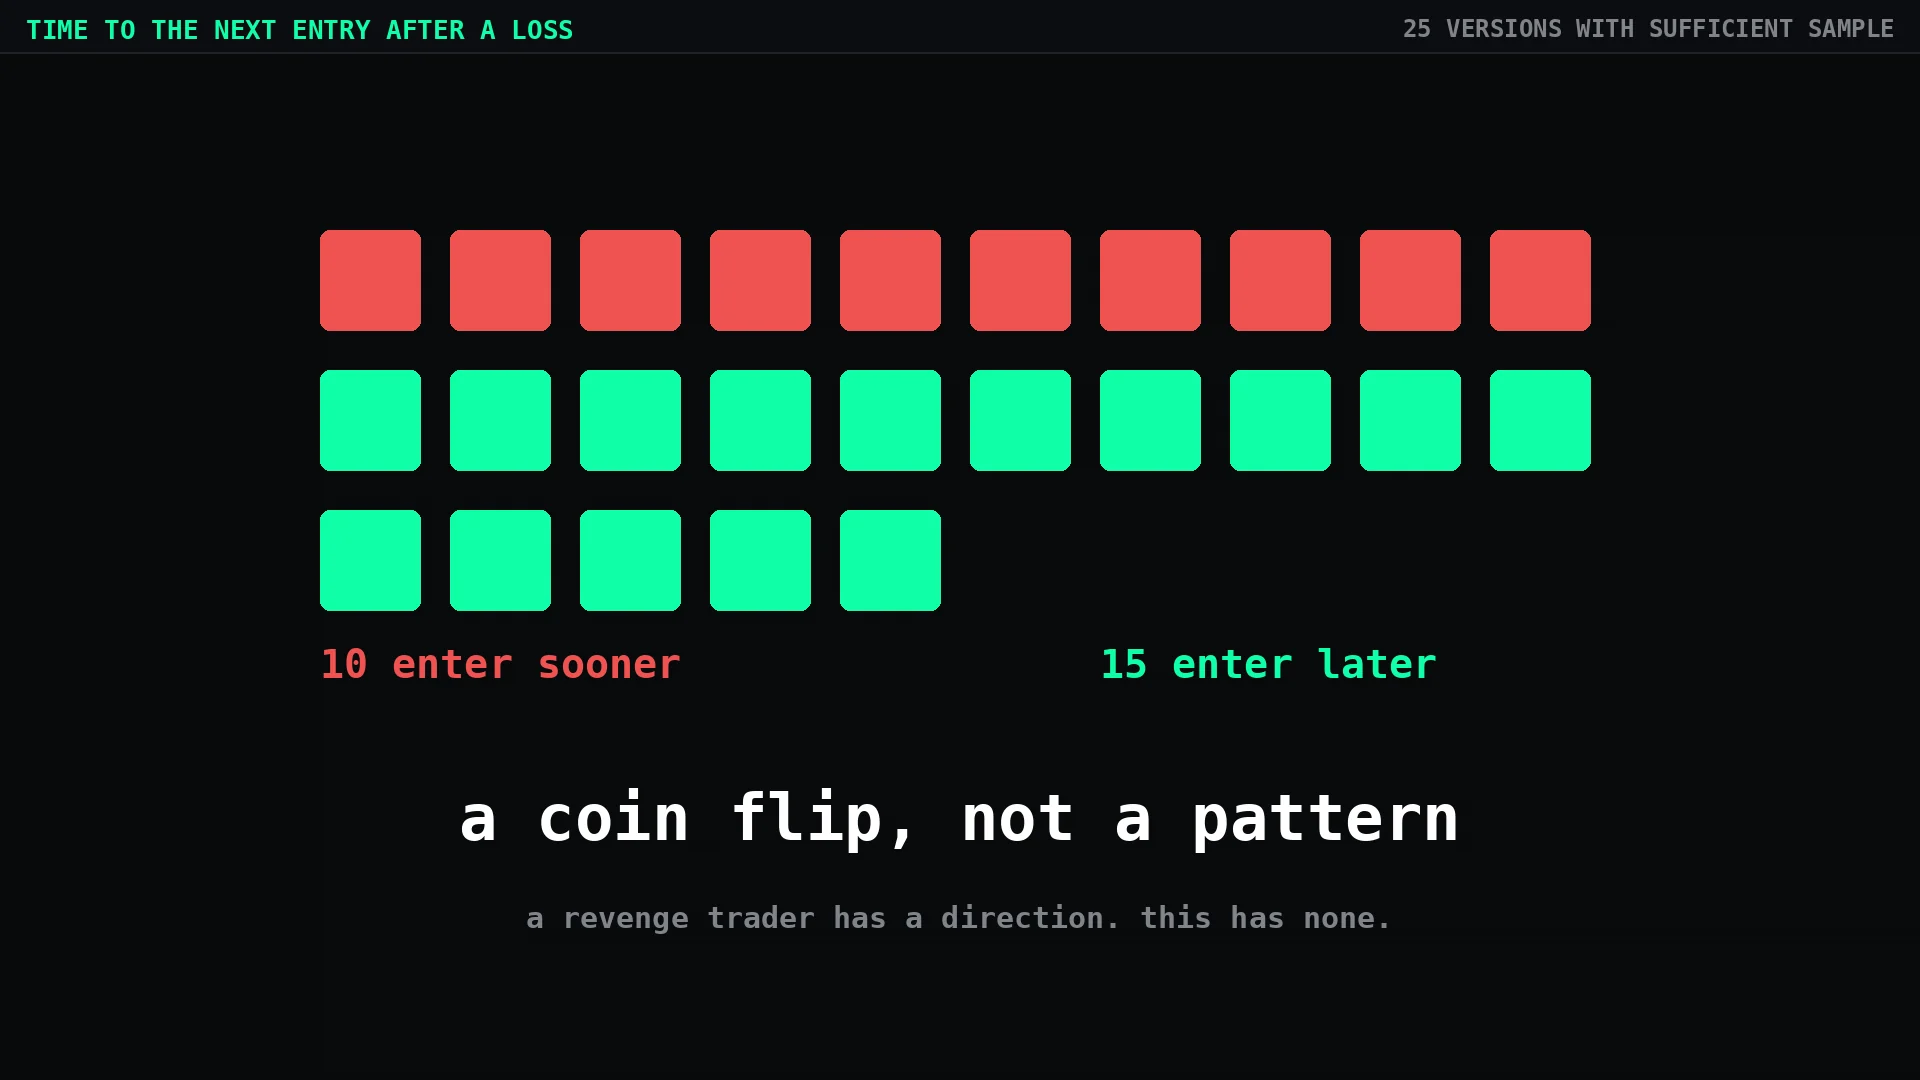
Across the 25 versions with a sufficient sample, ten enter sooner after a loss and fifteen enter later. That distribution is what you get from a coin flip. There is no rush after a loss, and there is no caution either — the entry conditions are evaluated the same way regardless of what happened before, because nothing in them refers to the previous result.
What this does and does not mean
It does not mean the system avoids losing streaks. It has them, like every system does. Five losing trades in a row is not rare and will happen on a funded account exactly as it happens on any other.
What the data says is narrower and more useful: the streak does not change what comes next. Same size, same entry conditions, same odds on trade six as on trade one. The streak exists in the account balance, not in the code.
It also does not mean a systematic approach is superior in every respect. It means one specific failure mode — the one the Chicago study measured in professionals with decades of experience — is structurally absent. Rules written down before the loss cannot be rewritten by it.

How to run this on your own log
You do not need our data to check this on yourself. Export your trade history, then:
- For each trade, find the previous closed trade and tag it as a win or a loss.
- Split your trades into two groups on that tag.
- Compare three things between the groups: average position size, win rate, and median time to entry.
If position size is higher in the post-loss group, you have a sizing problem that no amount of resolve will fix on a bad morning. If time to entry is shorter, you have a timing problem. Both are solvable the same way — by writing the rule down before the session, where the loss cannot reach it.
Methodology and limits
The test runs on the trade record of 29 strategy versions over twelve months: the modeled segment to 31 March 2026 and the live segment from 1 April 2026, on the same rule sets throughout. Both segments are included because the question is about the relationship between consecutive trades, which does not change with the layer — and the result holds when the live months are tested on their own. The permutation procedure and the Monte Carlo parameters are documented on the methodology page.
Sample sizes vary by version, and a handful of versions had too few post-loss observations to be included in the per-strategy tests. Across 29 tests, one result crossed the conventional 0.05 threshold on a 21-observation sample — which is precisely what random variation produces at that number of comparisons, and does not survive correction for multiple testing. We record it rather than remove it, and we will look at it again at the next data refresh.