What Happens to Your Drawdown Buffer After the First Payout (Trailing vs Static Floor)
A payout doesn’t give your funded account more room. It takes room away, and on a trailing floor it doesn’t come back until you earn it back.
Data layers: every figure here is modeled — a 1,500-path Monte Carlo (block bootstrap, three-year horizon, 25% trade dropout) over the twelve months of modeled data from September 2025 to August 2026. These are distributions across simulated paths, not results of any single account and not a forecast. Method at /methodology.
Most traders discover this two weeks after the transfer, when the same stops they’ve been running all month start landing on a buffer half the size. The account didn’t change. The rules didn’t change. The distance to the floor did.
This post walks through the mechanic, the numbers from a modeled run, a counterfactual that isolates the transfer itself, and the one number worth watching afterwards.
Watch the mechanic in 90 seconds — more on the channel at /yt.
Why the floor doesn’t move back
On an end-of-day trailing account, the drawdown floor follows your equity upward on every green close and never retraces. Make $500, the floor rises $500. Make another $500, it rises again. The distance between your balance and the floor — the buffer — stays roughly constant until the floor locks, however much you’ve earned.
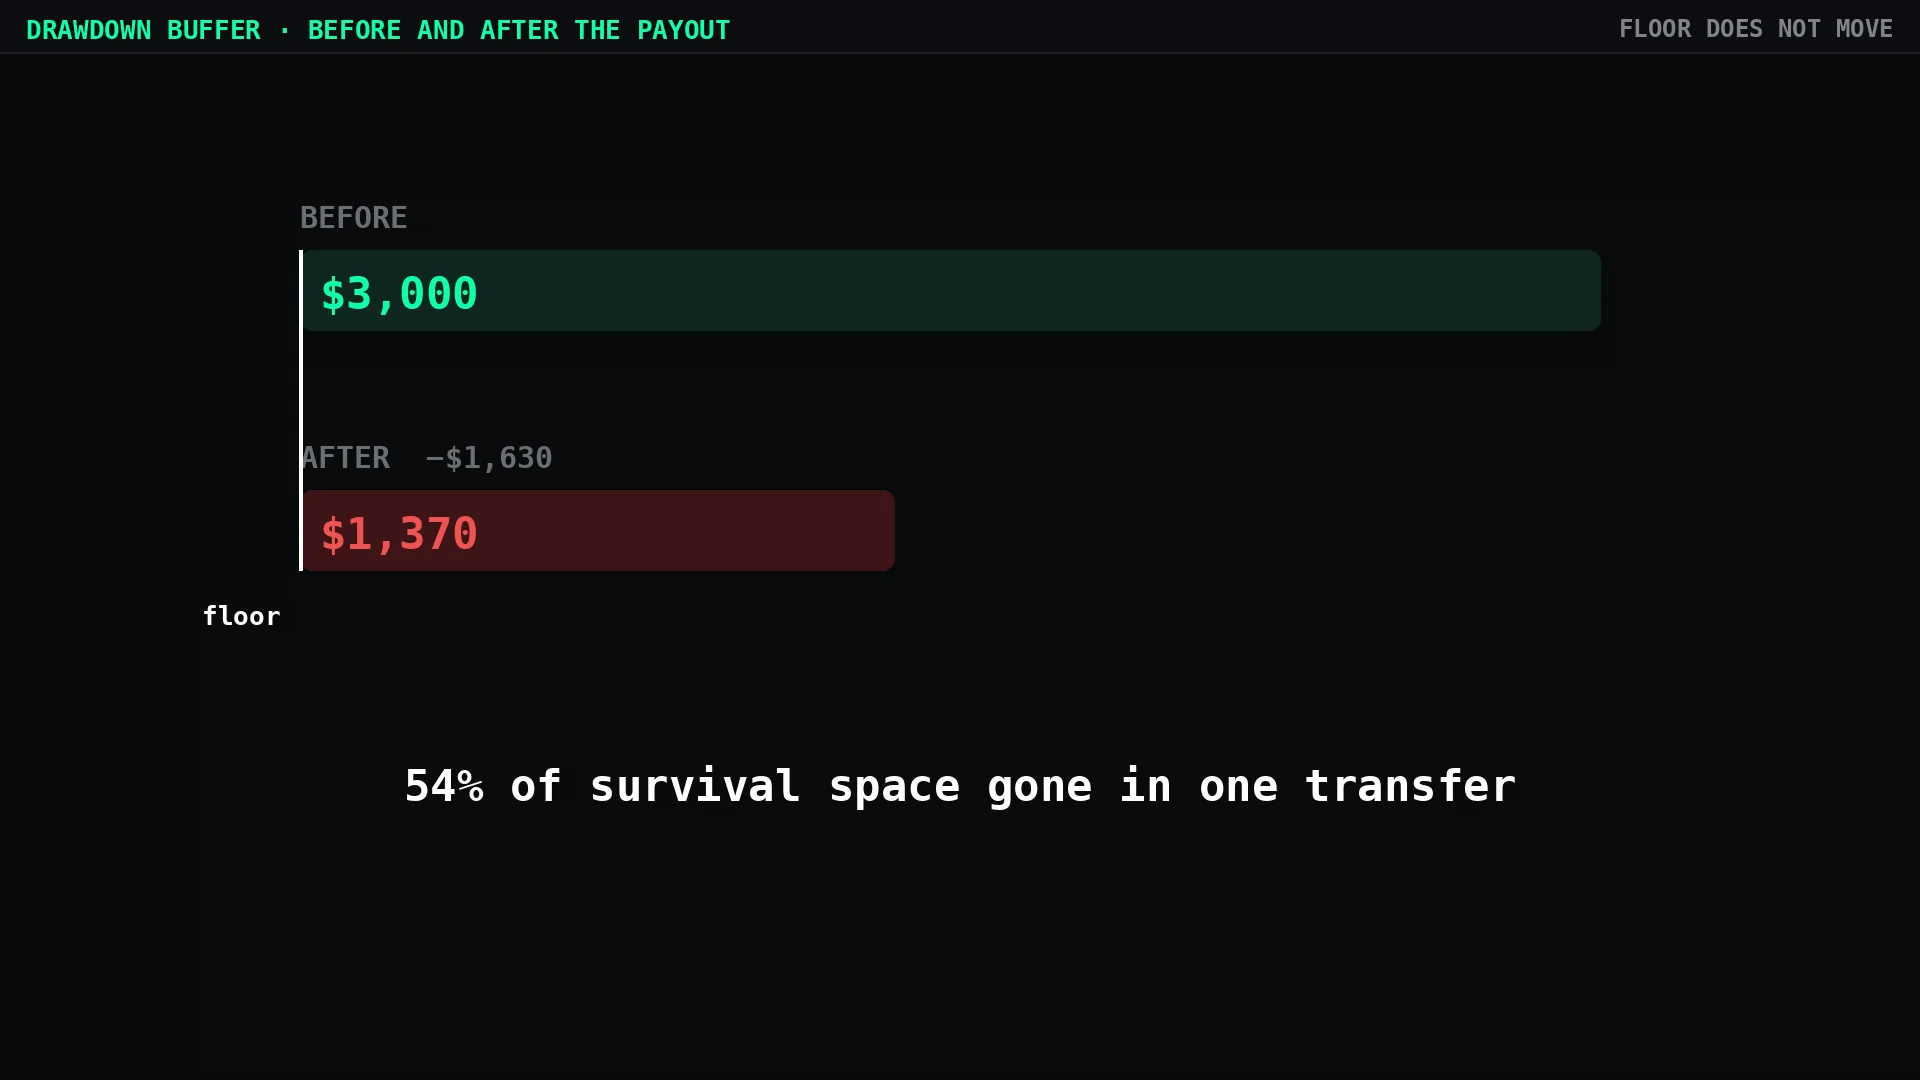
A withdrawal breaks that symmetry. Your balance drops by the amount you take out. The floor stays exactly where it was, because it only ever moves up. So the buffer, which was tracking your balance from below, is now tracking a balance that just fell — and the gap between the two has shrunk by the full payout.
The visualizer at /trailing-drawdown-visualizer lets you replay this on any floor type. The trailing version is the one where the payout costs you.
The numbers from a modeled run
The reference portfolio here is the 100K Balanced 4X futures preset, run through Monte Carlo — 1,500 simulated account lives, block bootstrap on daily returns, three-year horizon, 25% trade dropout, on the twelve months of modeled data from September 2025 to August 2026. Full method at /methodology. Every figure below is modeled: a distribution across simulated paths, not a forecast for any single account.
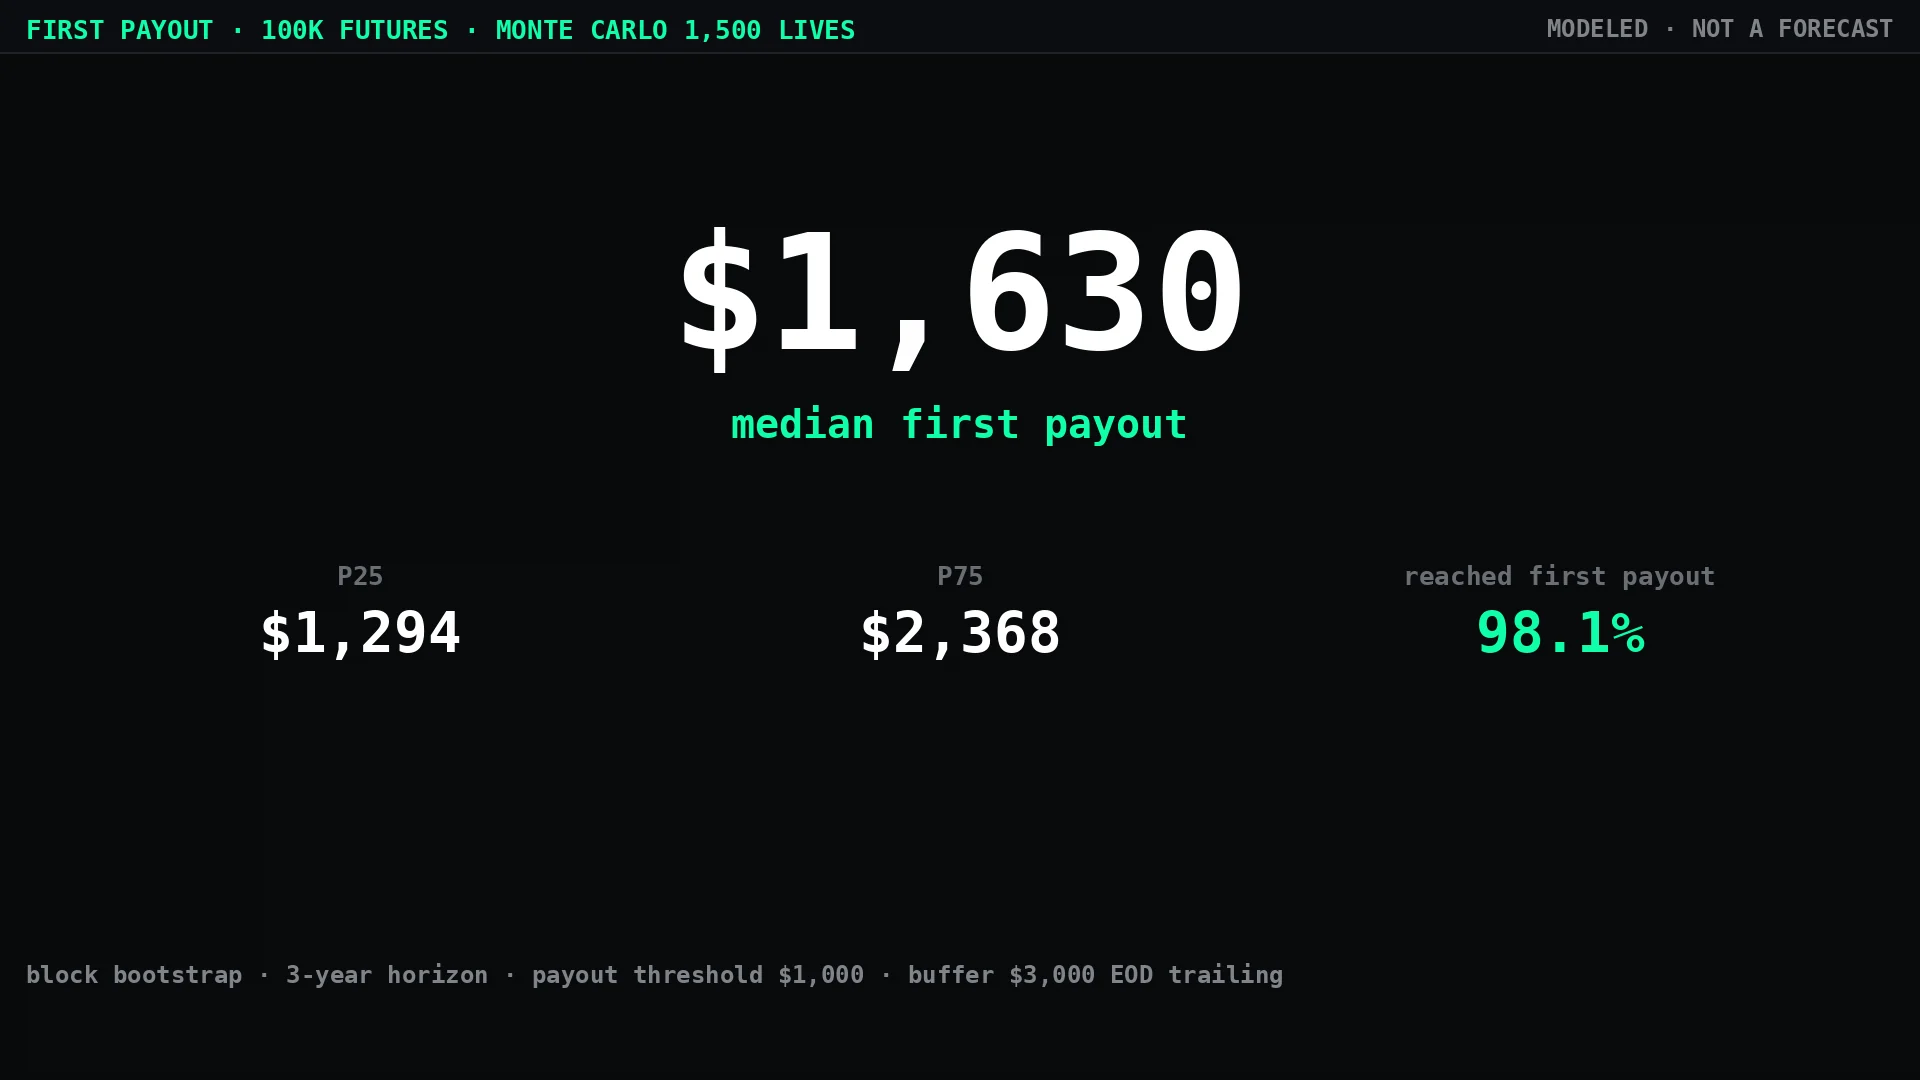
First payout — median $1,630, with the middle half of paths landing between $1,294 and $2,368. 98.1% of simulated lives reached a first payout at all.
Buffer after the payout — the account starts with $3,000 of trailing room. Withdraw the median $1,630 and the floor doesn’t move, so the buffer becomes $1,370. That’s 54% of the survival space gone in one transfer.
On the forex reference (Forex Prop Champion, 100K Swing) the same withdrawal costs 13% of the buffer, because that account runs a static floor at 90% of capital with a balance reset — the room is $11,460 to begin with and the payout takes $1,460 of it.
Same path, run twice
The obvious objection is that accounts which take payouts are different from accounts that don’t — they’re the ones that were doing well, so comparing the two groups after the fact tells you about selection, not about the transfer.
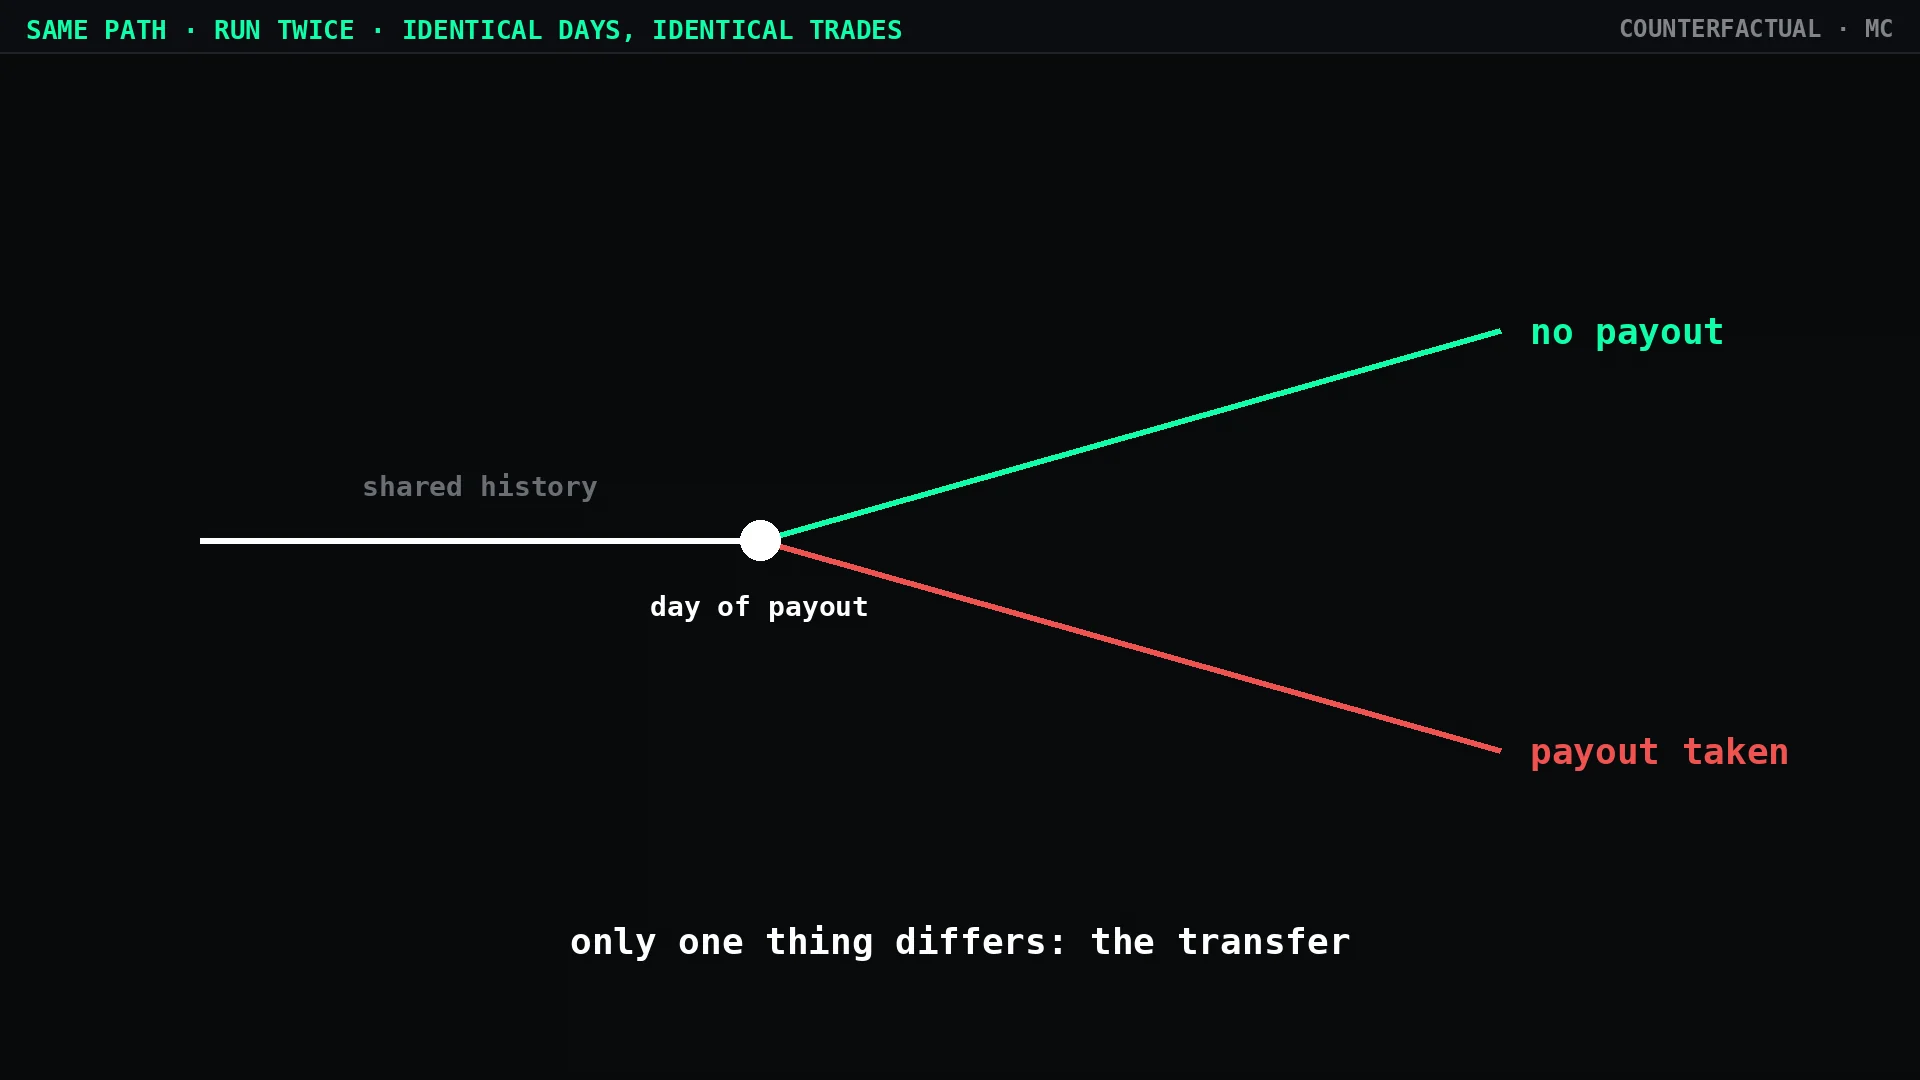
So the test is a counterfactual. Every simulated path that reached a payout was run twice from the day of the transfer: once with the payout taken, once without. Identical trade sequence, identical days, identical everything. Only one thing differs.
Breaches within 14 days — futures 100K, modeled:
| paths | breached within 14 days | |
|---|---|---|
| payout taken | 1,472 | 19.84% (292) |
| no payout, same path | 1,472 | 1.49% (22) |
| difference | +18.3 points · 13.3× |
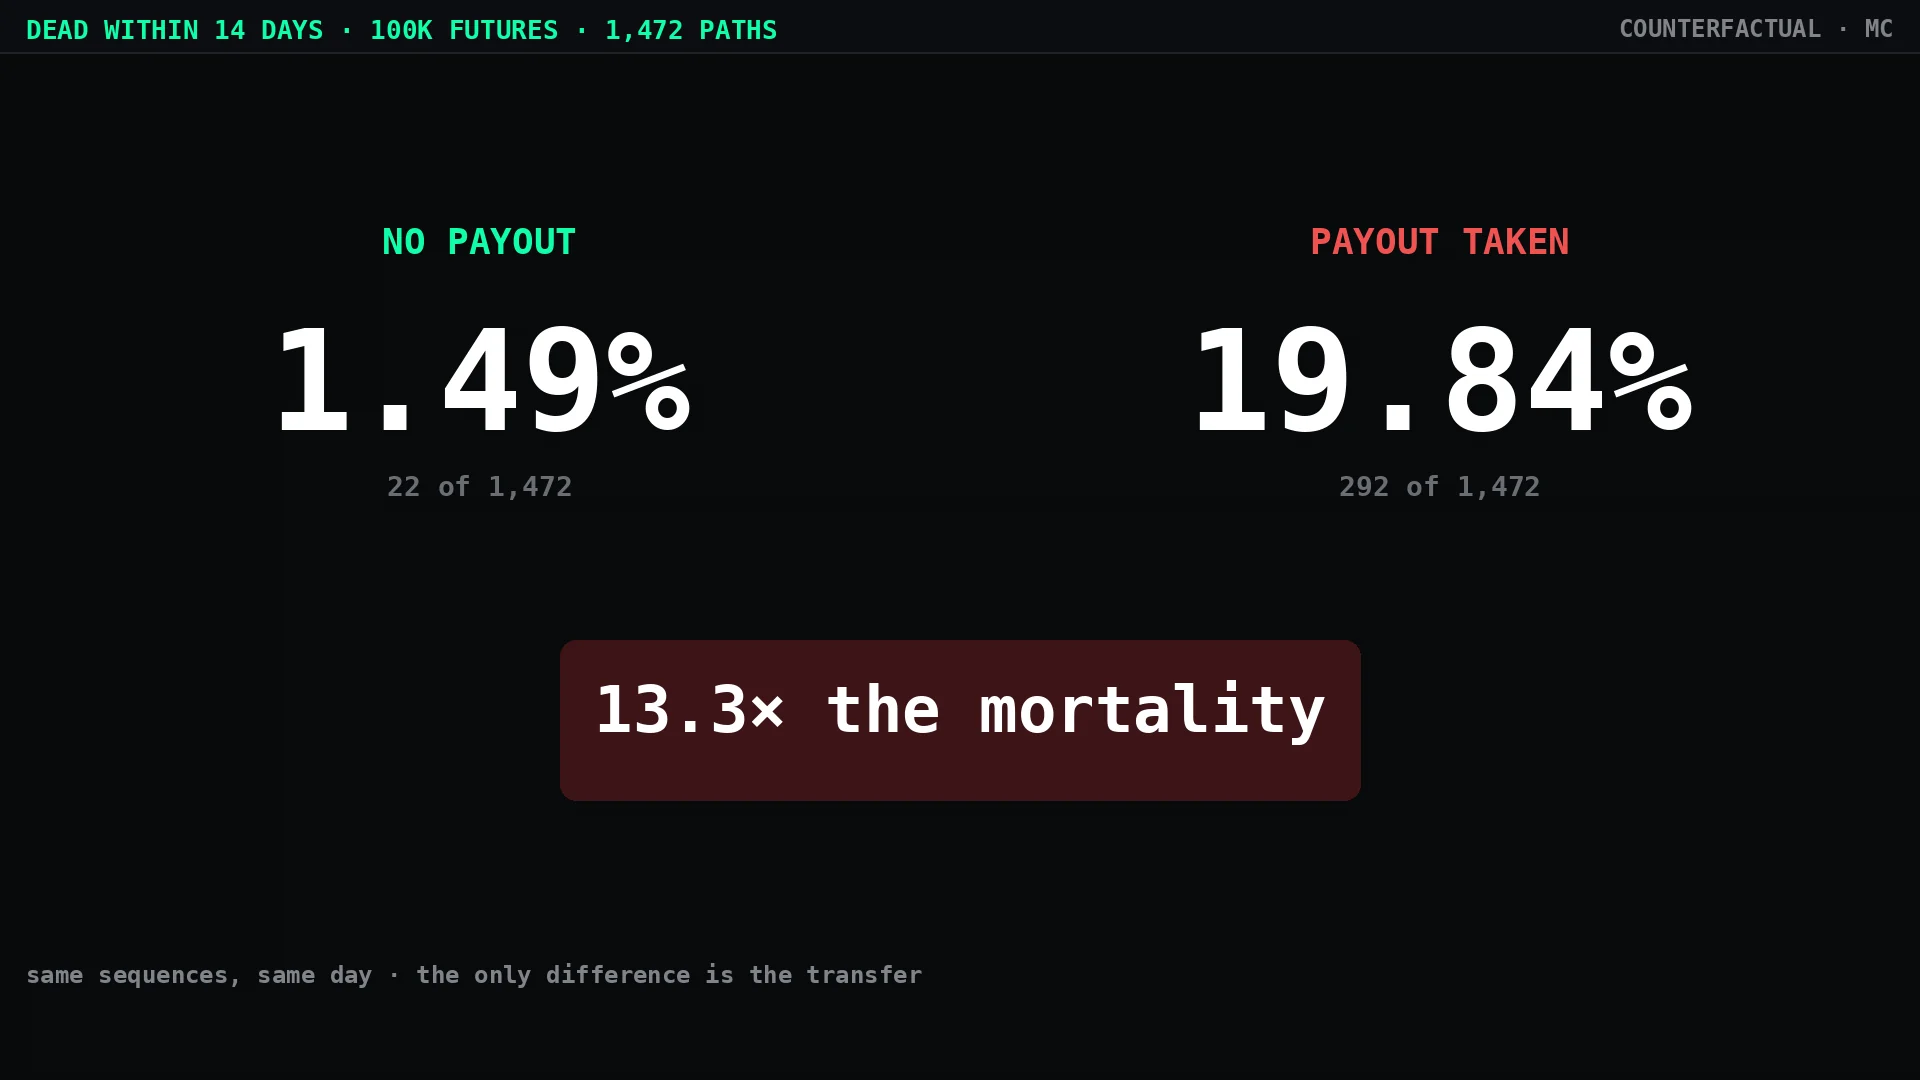
Thirteen times the mortality, from the transfer alone. The trades were the same. The market was the same. What changed was the room those trades had to be wrong in.
On the forex reference the same test returns zero breaches in either branch. That’s not because forex is safer — it’s because the static floor and the deeper buffer mean the payout leaves the account with more room than the futures account has before it withdraws anything.
Why the transfer kills: sizing is tied to the tier, not the room
Position size on a funded account is set by the account tier — 50K, 100K, 150K — not by how much drawdown room is currently left. After a payout the stops are the same. The room behind them isn’t.
That’s true of our presets too. The sizing is derived from the tier’s drawdown limit, and there’s nothing in the methodology that recomputes it when the buffer shrinks after a withdrawal. Which is the honest reason the mortality number looks the way it does: the accounts that died weren’t doing anything different in the two weeks after the payout. They were doing exactly the same thing, in a room that had halved.
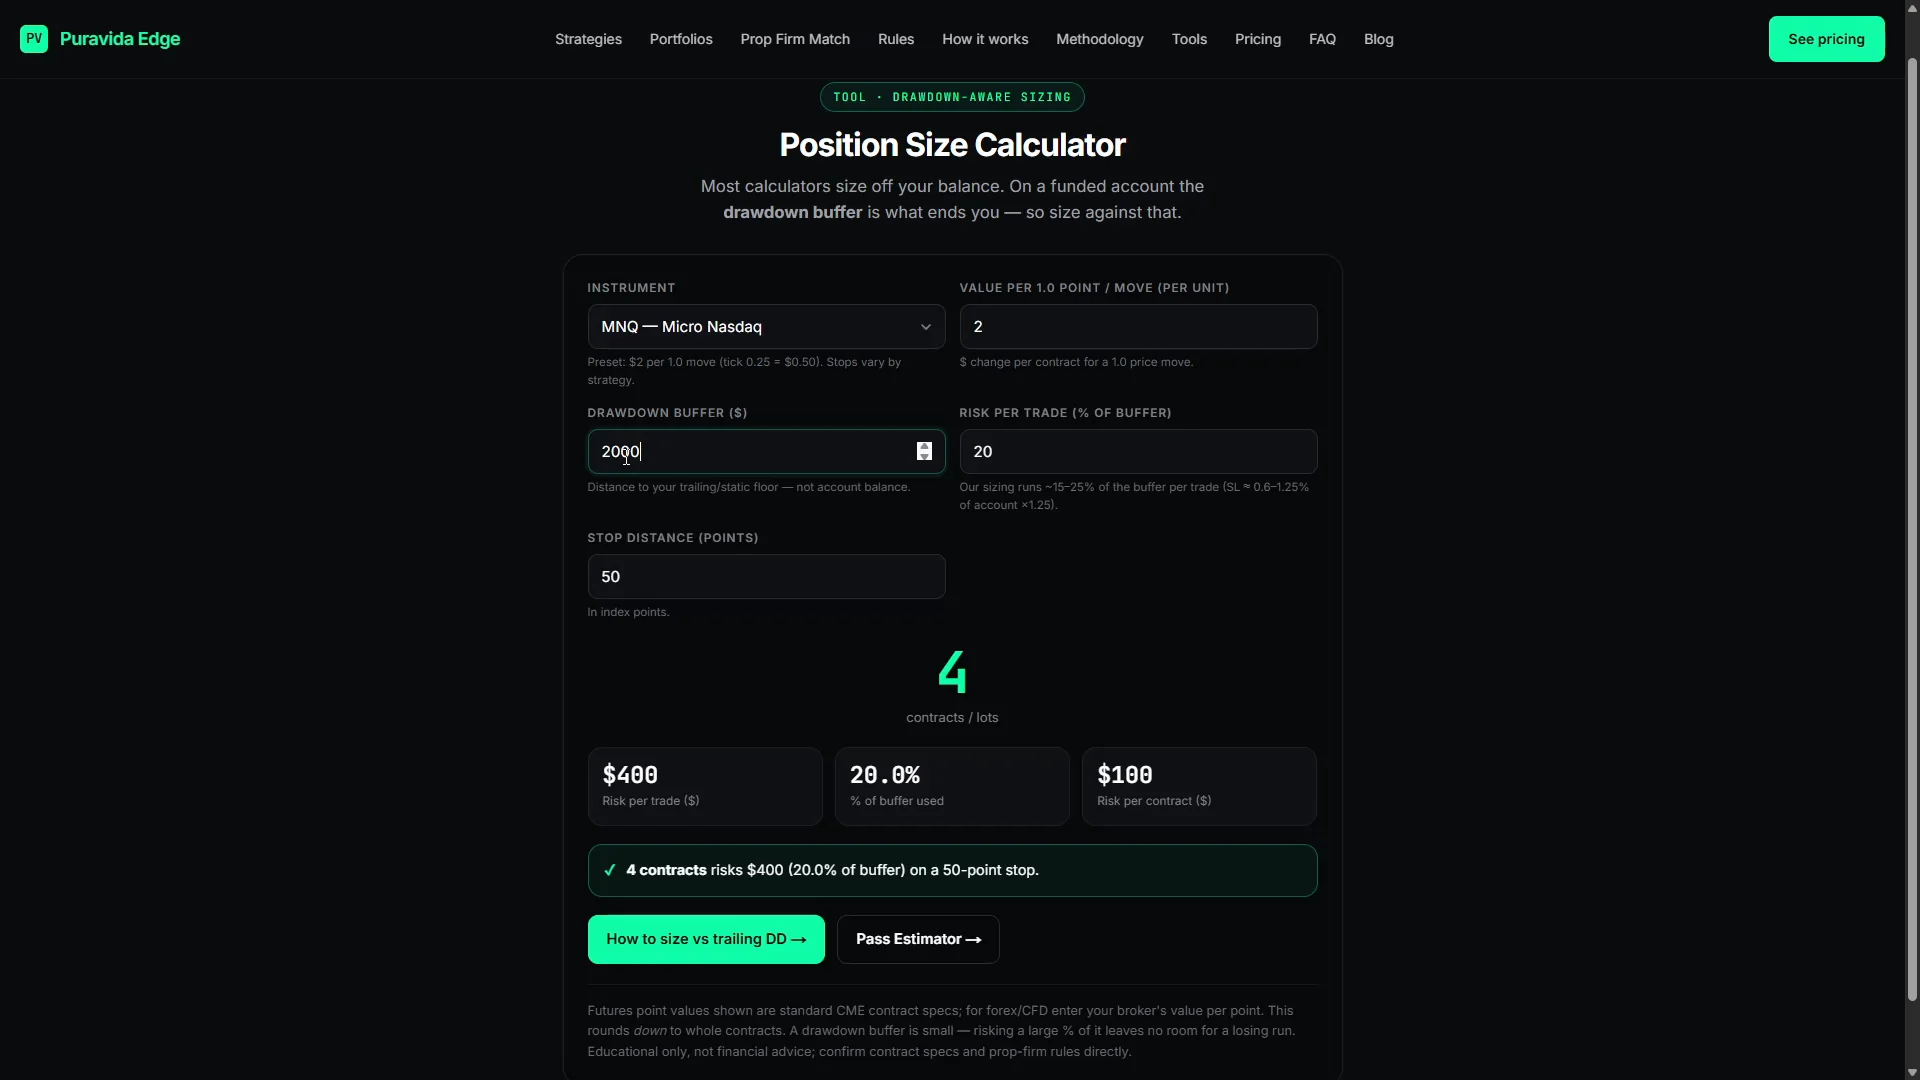
The arithmetic, with a 50-point MNQ stop at 20% of buffer per trade: $3,000 of room supports 5 contracts. $2,000 supports 4. $1,500 supports 3. The calculator at /position-size-calculator does this from the buffer rather than the balance, which is the direction the number has to be read in.
Trailing versus static
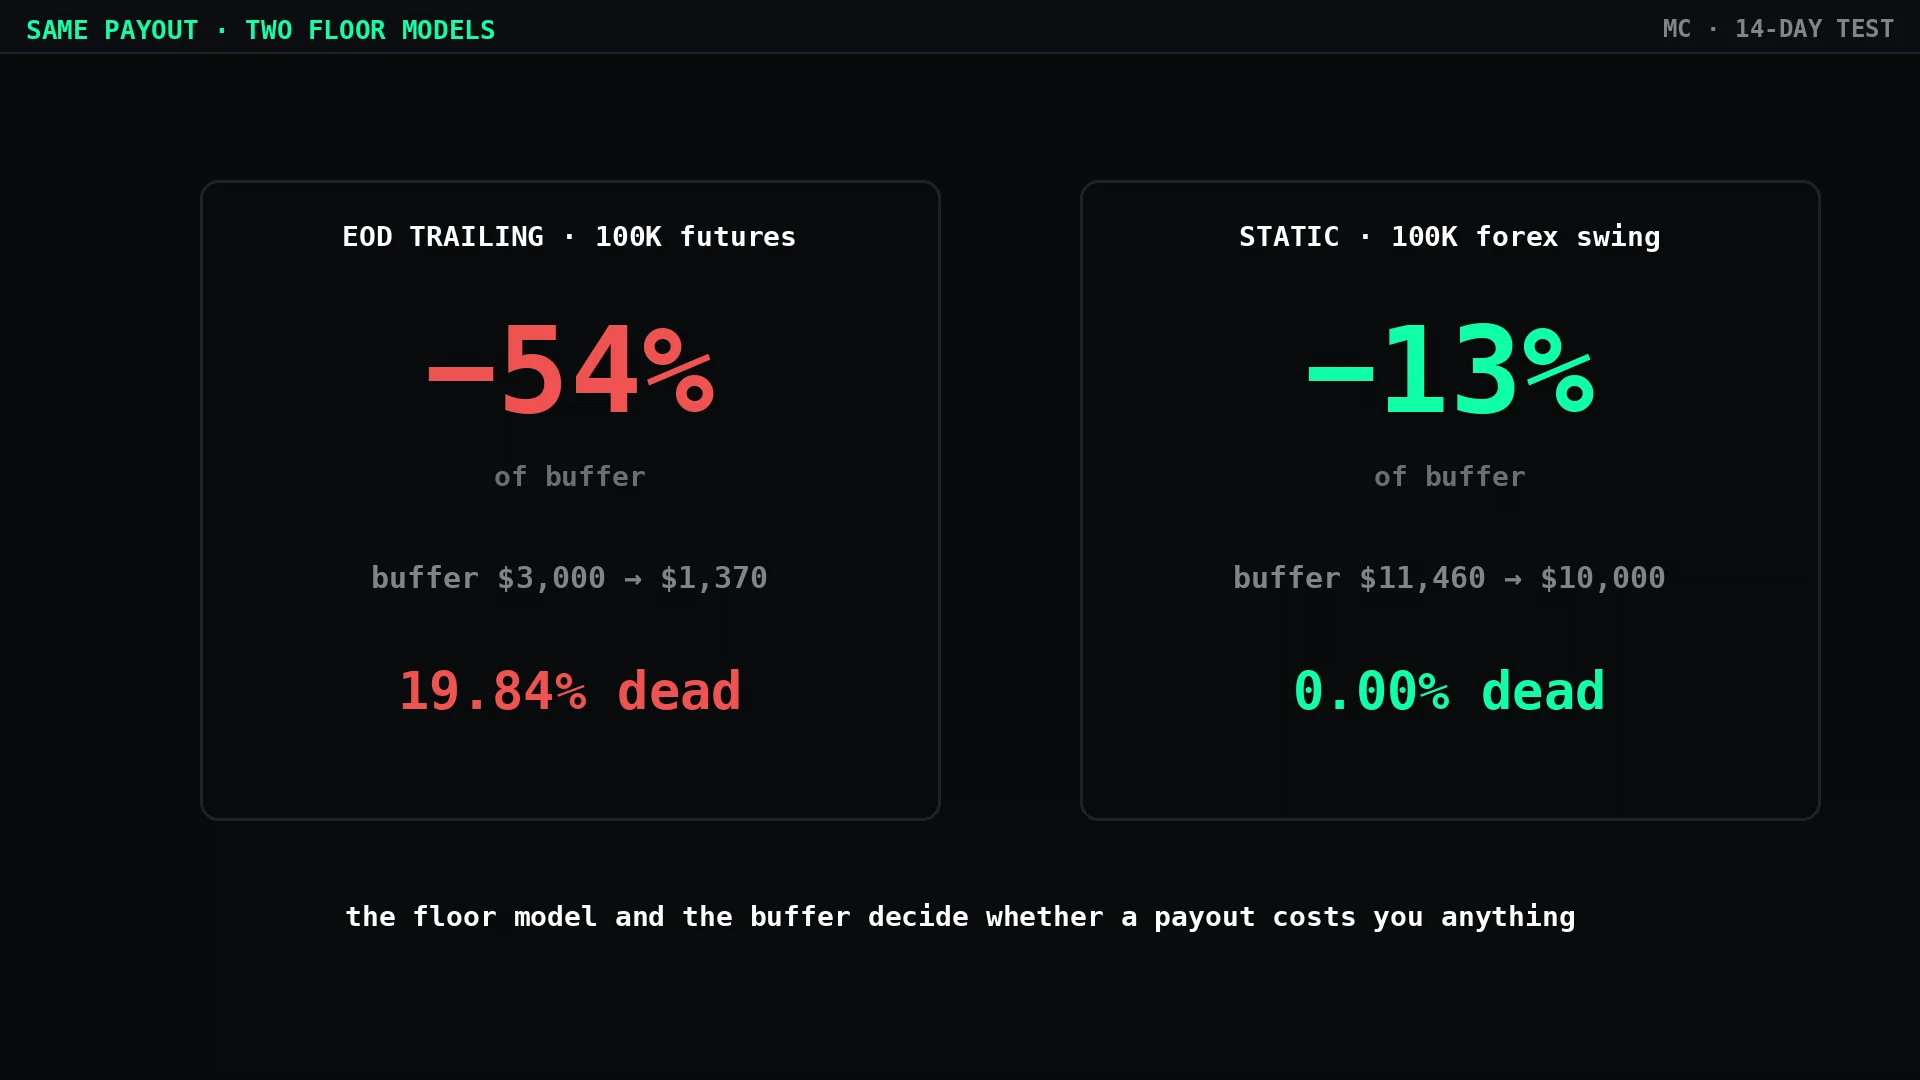
The two floor models produce different worlds from the same withdrawal:
| EOD trailing (futures 100K) | static floor (forex 100K Swing) | |
|---|---|---|
| buffer lost to median payout | 54% | 13% |
| 14-day breach rate after payout | 19.84% | 0.00% |
The floor model and the buffer size decide whether a payout costs you anything. On a trailing account with a $3,000 buffer, it costs you more than half your survival space. On a static account with a deep buffer, it costs you almost nothing measurable.
What to watch after a payout
The balance is the number the platform shows you. It’s the wrong one.
The number to watch after a payout is the distance to the floor. Compute it the day of the transfer, and size against it rather than against the balance the sizing table assumes. If the buffer went from $3,000 to $1,370, the position that was appropriate yesterday is appropriate for an account more than twice the size of the one you now have.
Two habits follow. First, check the floor mechanics before the first payout, not after — the visualizer shows exactly where the room goes. Second, run the position size calculator from the buffer every time the buffer changes, which on a trailing account means every payout. The rules of the account didn’t change; the account did.
All figures are from a modeled Monte Carlo run and describe distributions across simulated paths, not results of any single account. Modeled results are not a forecast. Past performance does not guarantee future results. Not financial advice.