The same trade on three drawdown floors
A trade that closes at break-even should cost you nothing. On an intraday trailing floor it can cost almost two thirds of the room you have left.
Data layers: trade statistics come from the exported trade record at 100K presets — modeled to 31 March 2026 and live from 1 April 2026, on the same rule sets. The worked example (Zone MNQ, 11 June 2026) is a live trade. Survival figures are a forecast: Monte Carlo, 1,500 simulated account lives. The layers are never blended into a single figure. Method at /methodology.
A trade that closes at break-even should cost you nothing. On one of the three drawdown models prop accounts use, it can cost you almost two thirds of the room you have left. The trade did nothing wrong. The floor did exactly what it was designed to do.
The mechanic in 100 seconds — watch page with full transcript.
Three floors, one sentence each
Every funded or evaluation account has a level that ends it — the drawdown floor. How that level moves is the single most consequential rule in the account, and it comes in three versions.
A static floor never moves. It sits at a fixed distance below your starting balance for the life of the account.
An end-of-day trailing floor follows your equity upward, but only on the closing balance of each day. What happens inside the session does not touch it.
An intraday trailing floor follows every unrealized peak, in real time. If an open position is up, the floor rises with it — whether or not you ever keep that profit.
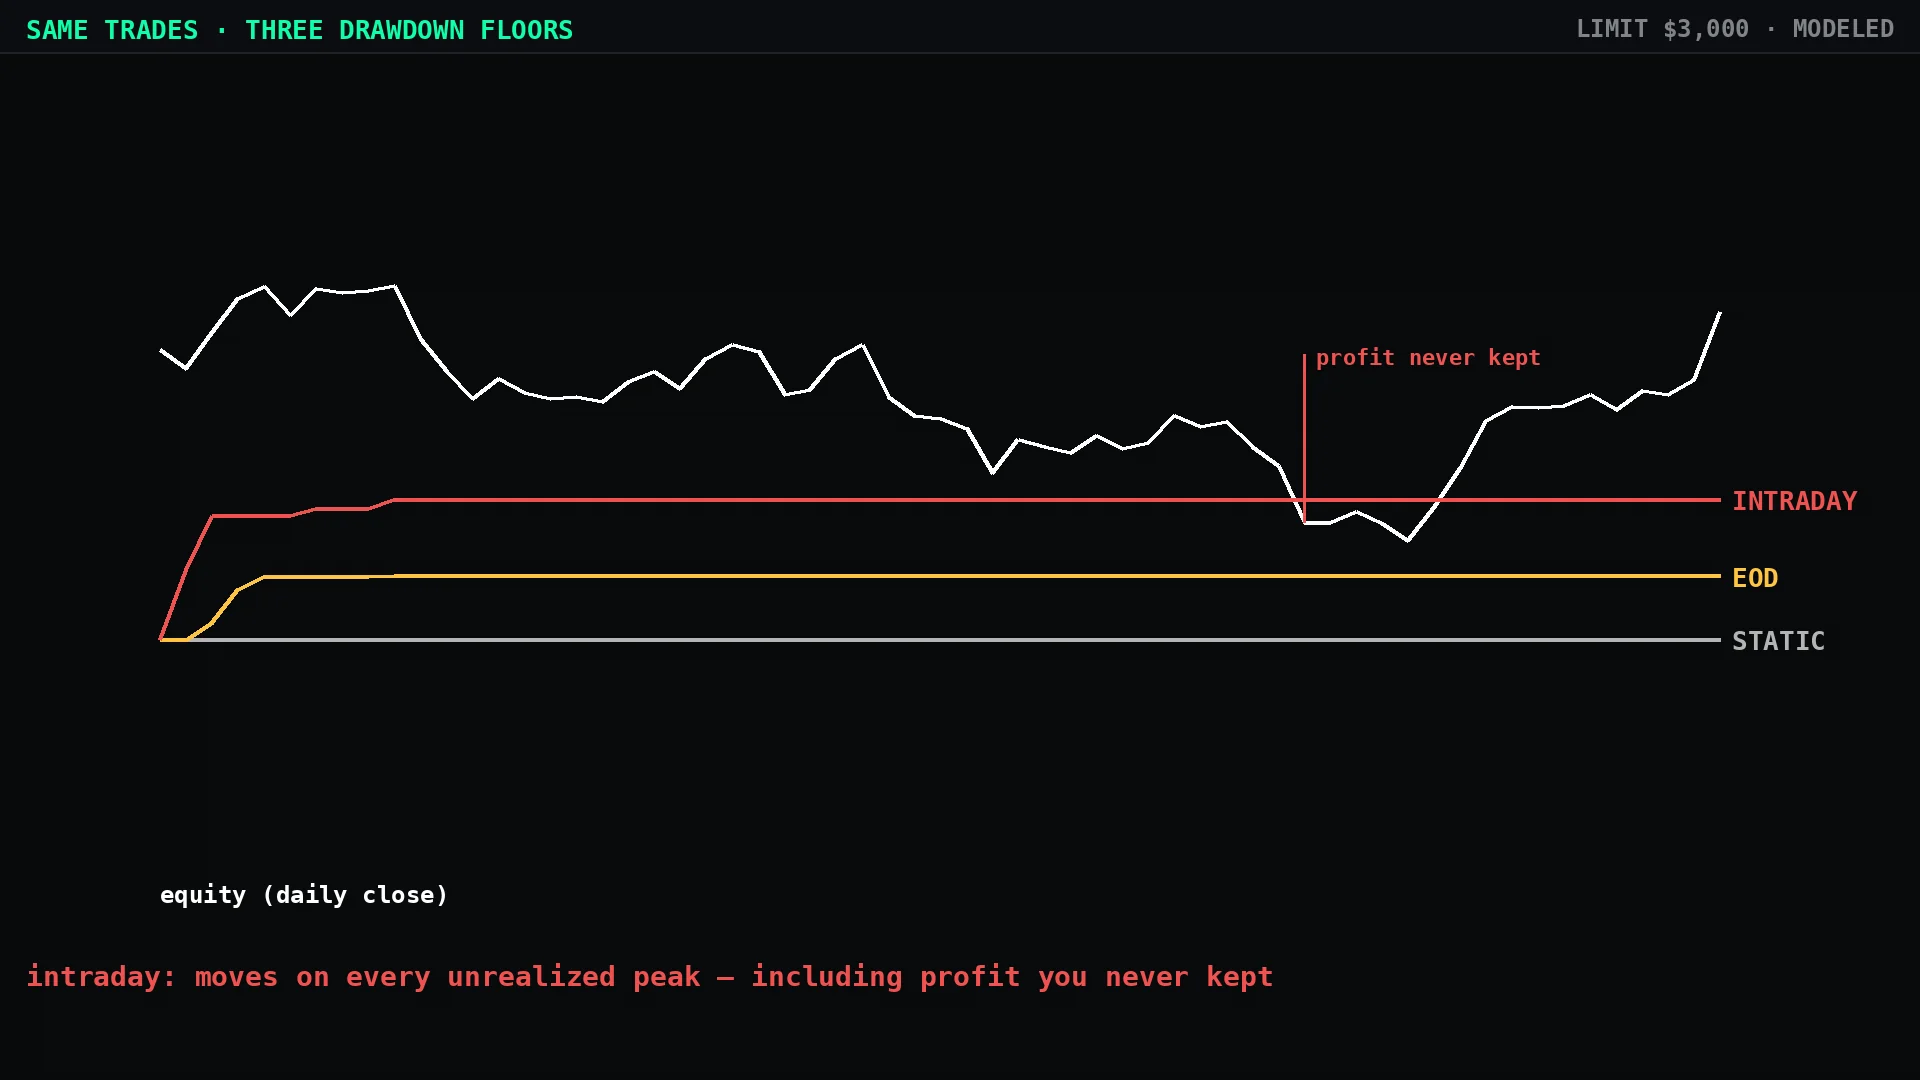
The first two are easy to reason about. The third one is where accounts get lost on days that looked fine.
One trade, closed flat
Here is a real trade from our catalog. Zone, on micro Nasdaq futures, June 11, 2026, at the 100K preset. Long at 9:31. Eighty-four minutes later the position is up $1,874. Then it comes all the way back and closes at minus three dollars — flat, for all practical purposes.
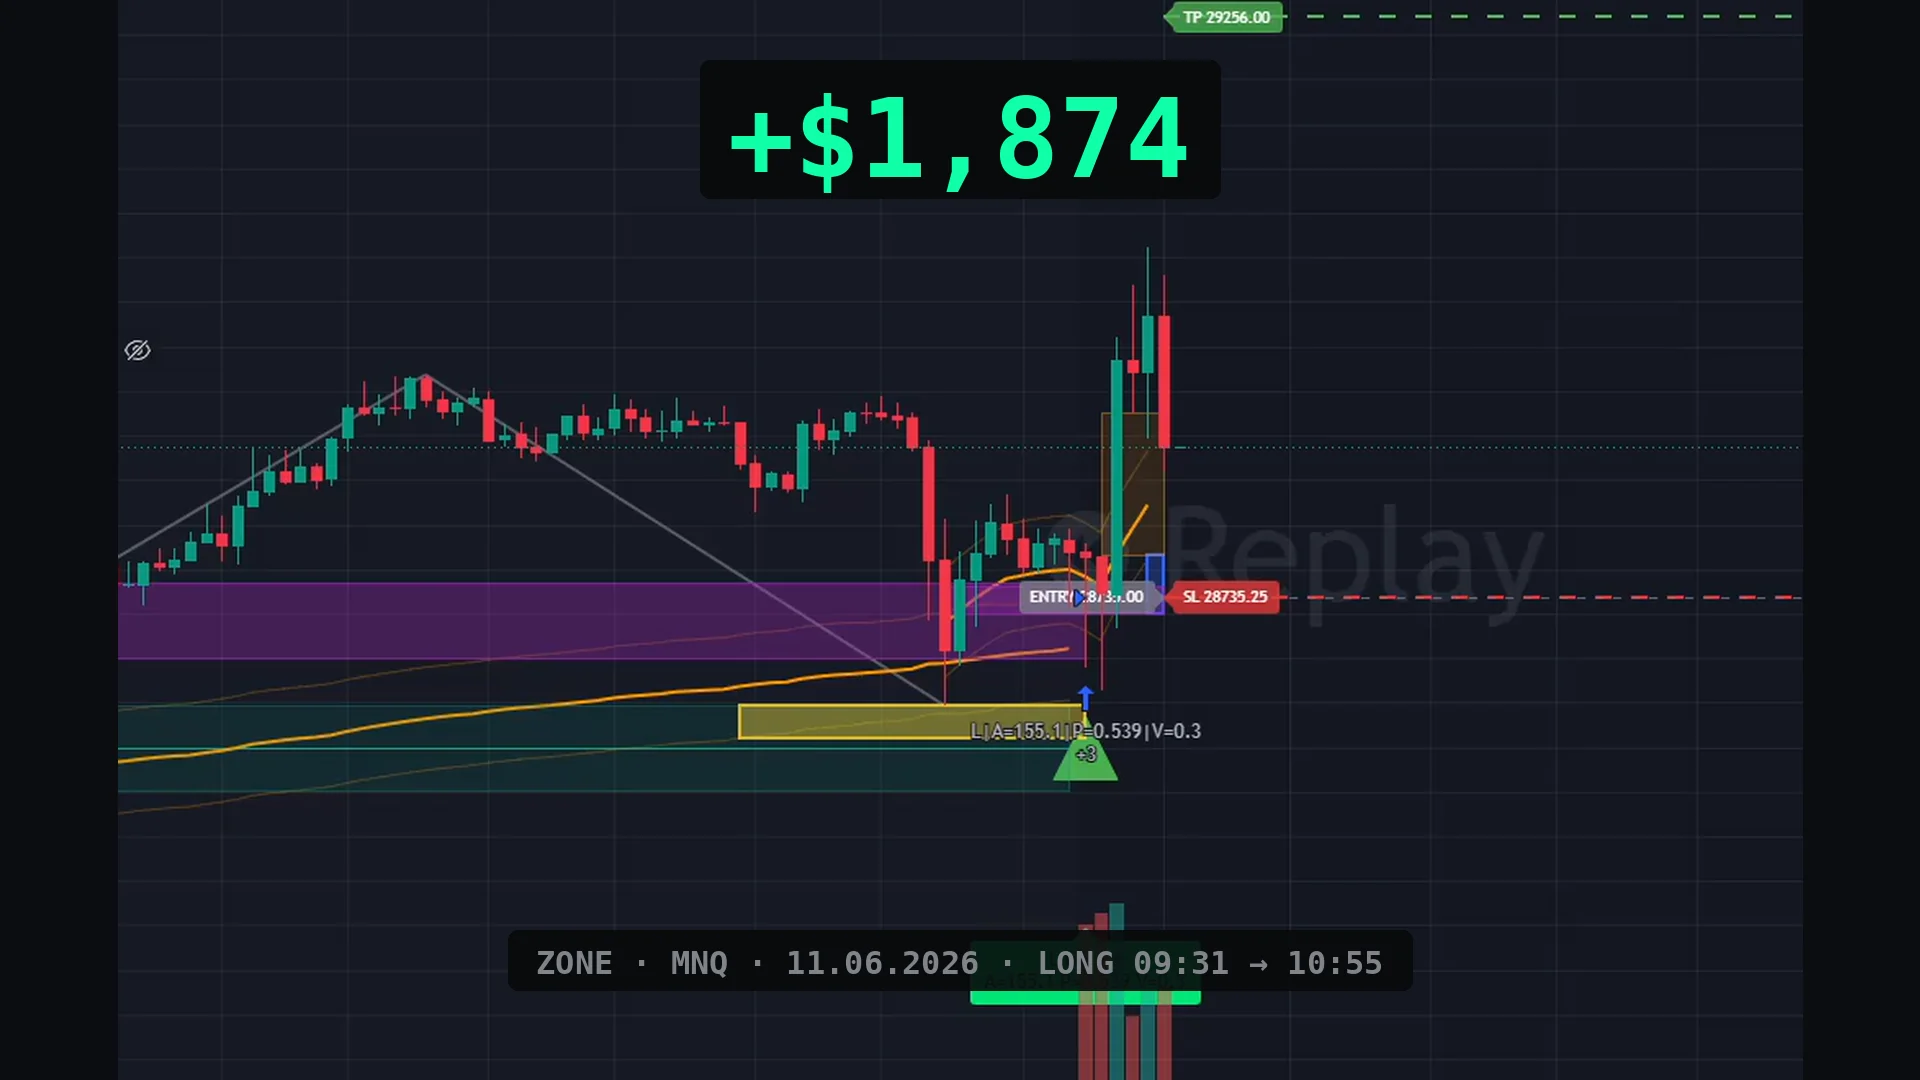
On a static floor, nothing moved. On an end-of-day floor, nothing moved either: the day closed flat, so the closing balance never set a new high.
On an intraday floor, the floor rose $1,874 at the peak — and it stays there. The position returned to where it started. The floor did not.
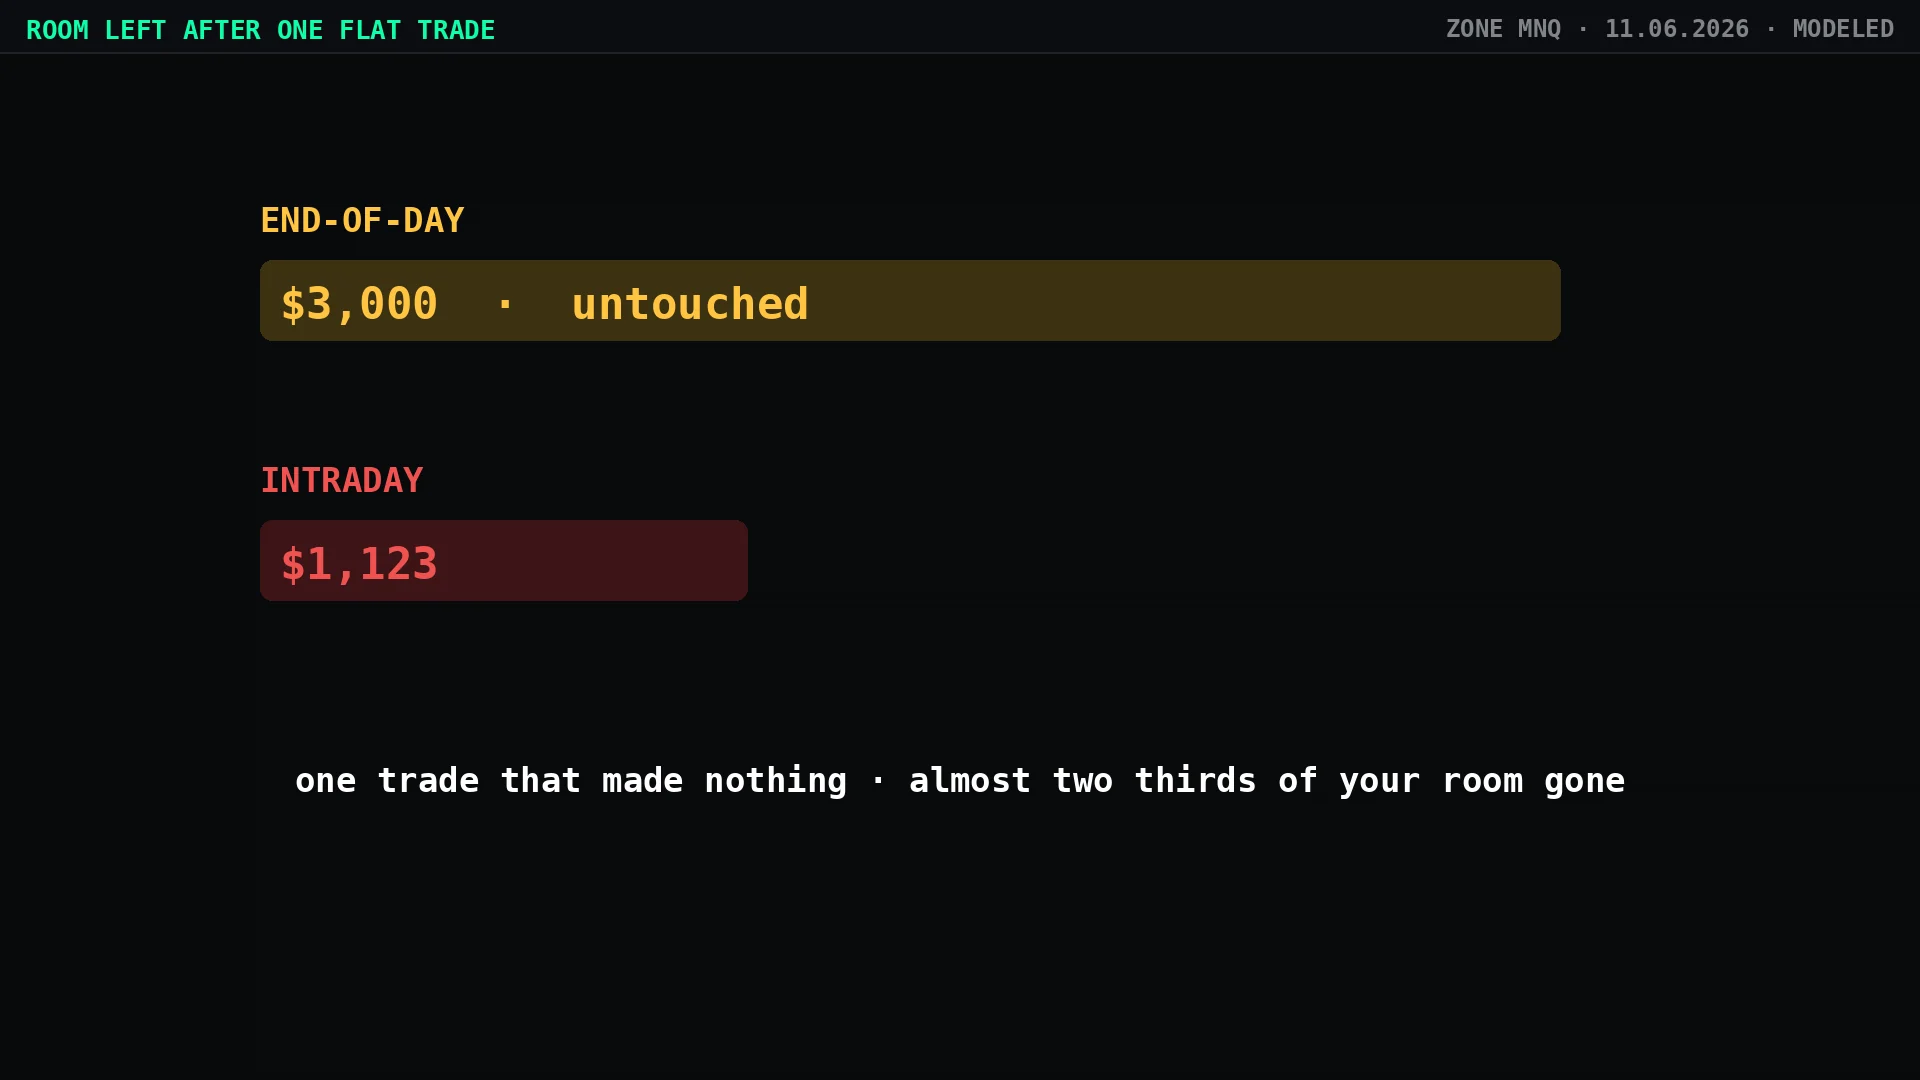
On a fresh account with a $3,000 limit, that leaves $3,000 of room on end-of-day and $1,123 on intraday. One trade that made nothing, and 62% of the room is gone.
A single trade like this cannot end a fresh account on its own — the floor always lands at the peak minus the limit, and this trade gave back less than the limit. What it does is spend the ammunition you would have had for the next bad stretch. The account is now one ordinary losing sequence away from the end, on a day the P&L says nothing happened.
The same portfolio across 1,500 simulated lives
One trade is an illustration. The question that matters is what the floor model does over a year of normal trading.
We took one portfolio — 100K Balanced 4X, with a $3,000 limit — and ran the same trade sequence through all three floor models, 1,500 simulated account lives each, three years, no forced withdrawals.
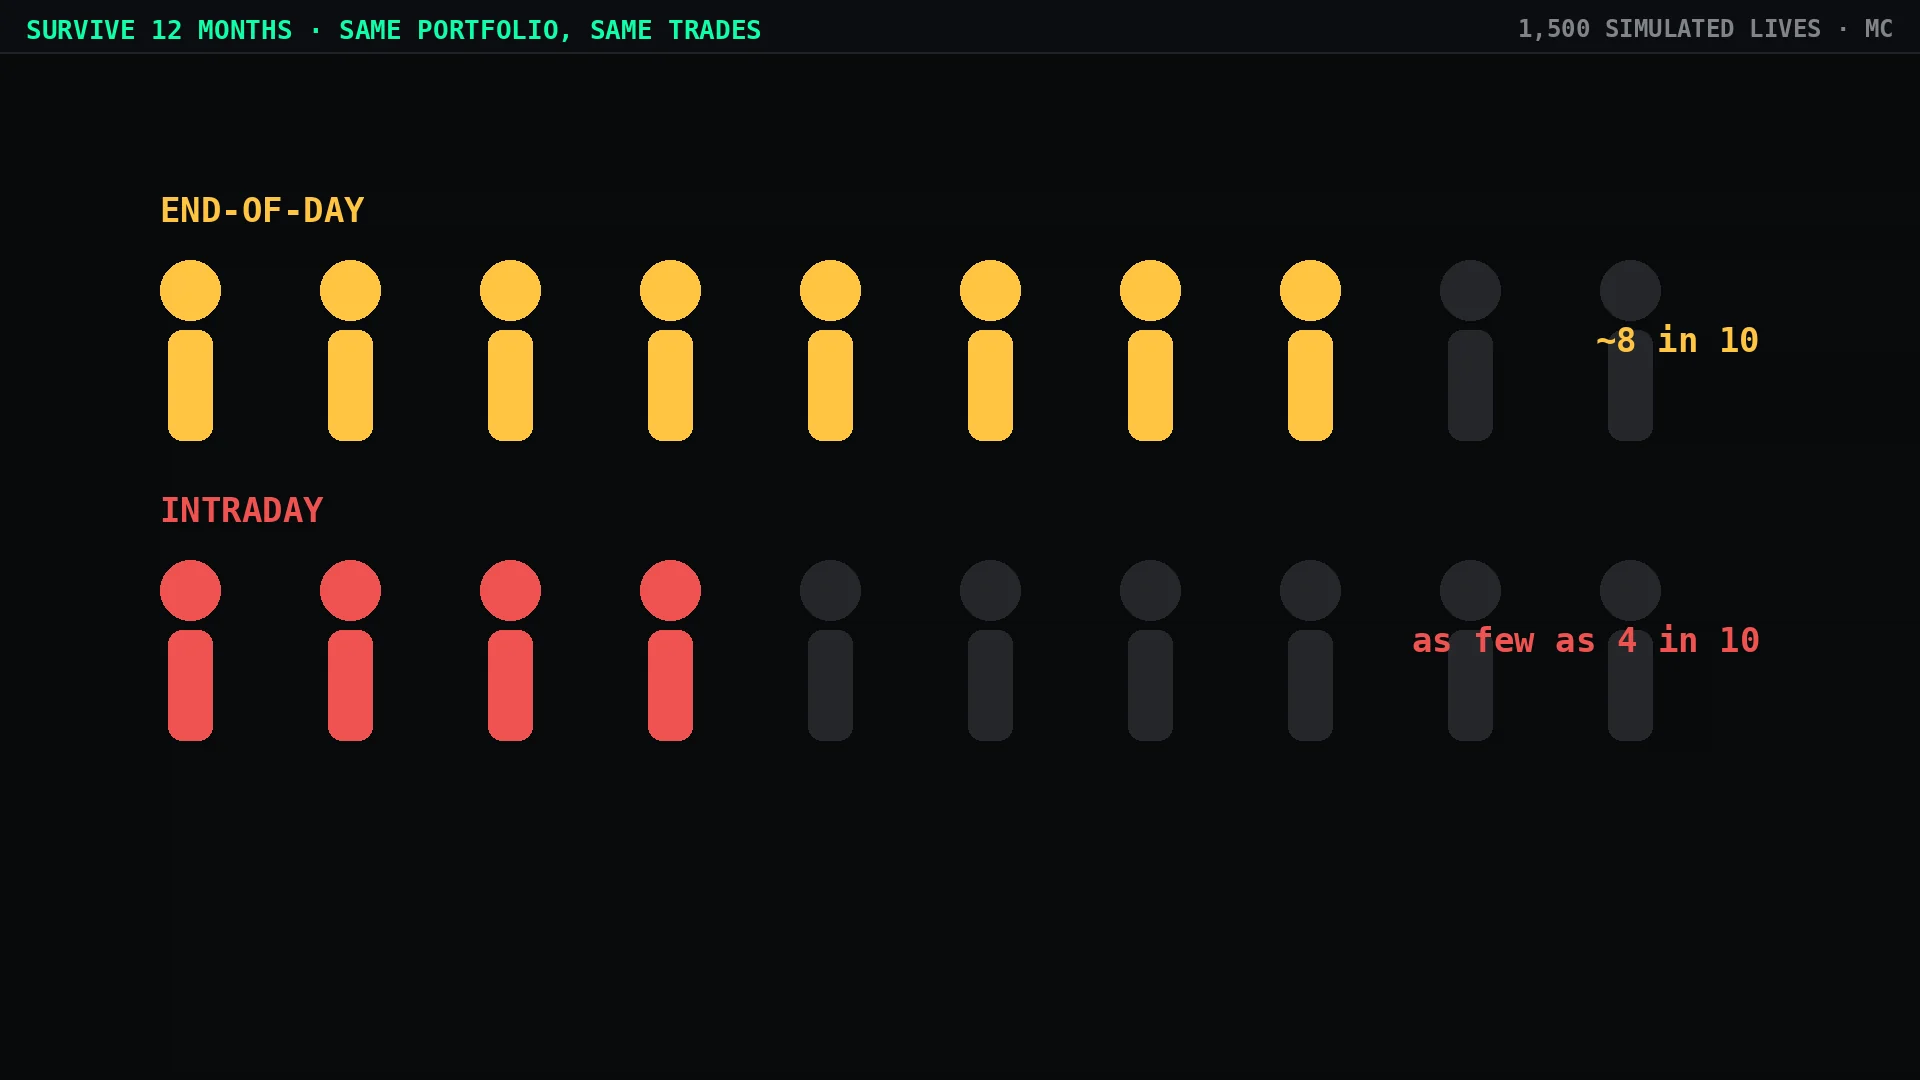
On a static floor, 92–94% of accounts survived twelve months. On end-of-day trailing, 81–85%. On intraday trailing, anywhere from 44% to 84%.
That last figure is a range for an honest reason. From a list of trades we know the peak and the trough of each position, but not which came first. If the trough comes first, intraday behaves almost like end-of-day. If the peak comes first — which is exactly what happens in every trade that gives back profit — survival over a year drops to 44%. In that case, on identical trades, intraday trailing ends accounts up to four times as often as end-of-day.
Dying on a green day
The most counterintuitive number in the set: when a trade gives its profit back, three in four intraday account deaths land on a day that closed green.
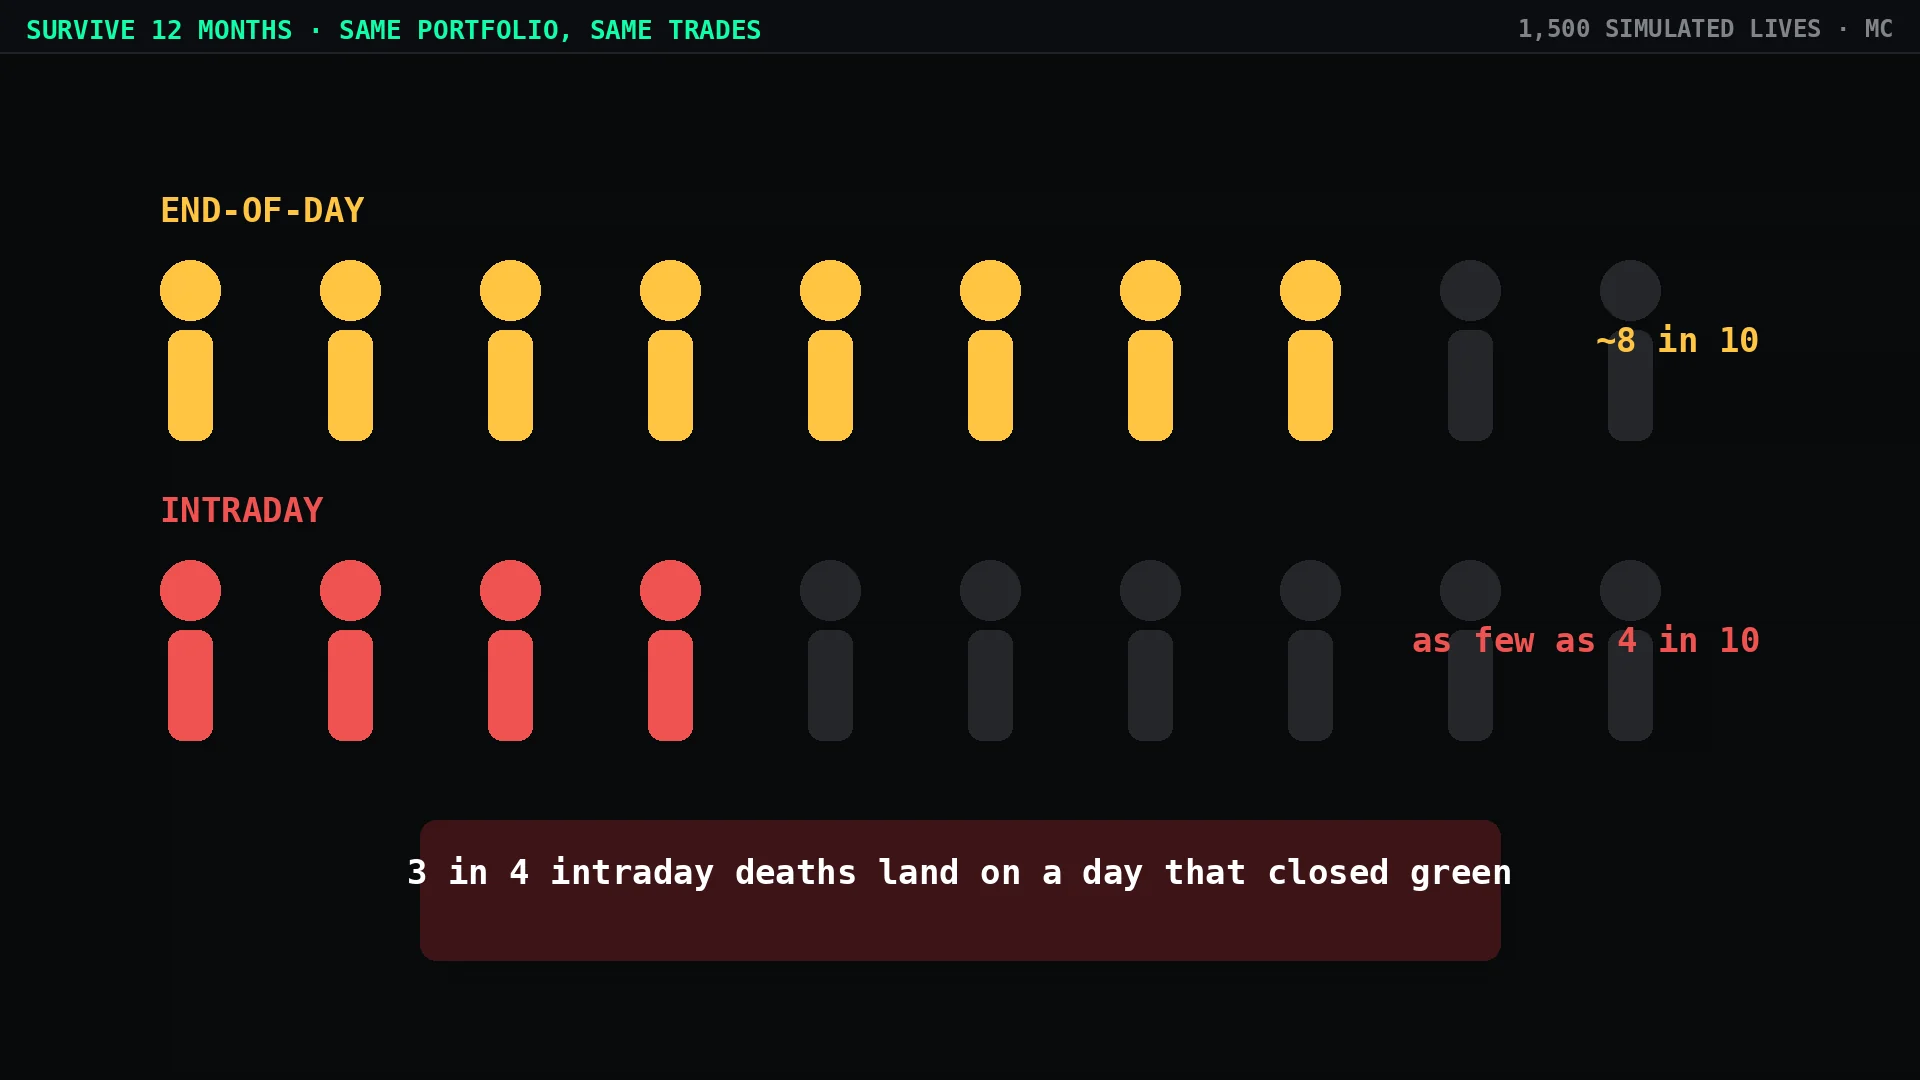
The mechanics are simple once you see them. The floor rises on the intraday peak. The price falls back far enough to touch the new floor. By the close it has recovered and the day ends positive. The account is already gone.
This is why end-of-day statements are a poor guide to risk on an intraday account. The number that ended the account never appears in the daily P&L.
Which strategies are exposed
Not every system is equally affected. What matters is how much of its intraday peak a strategy typically gives back before it exits — because on an intraday floor, that give-back is charged against your room even when the trade closes fine.
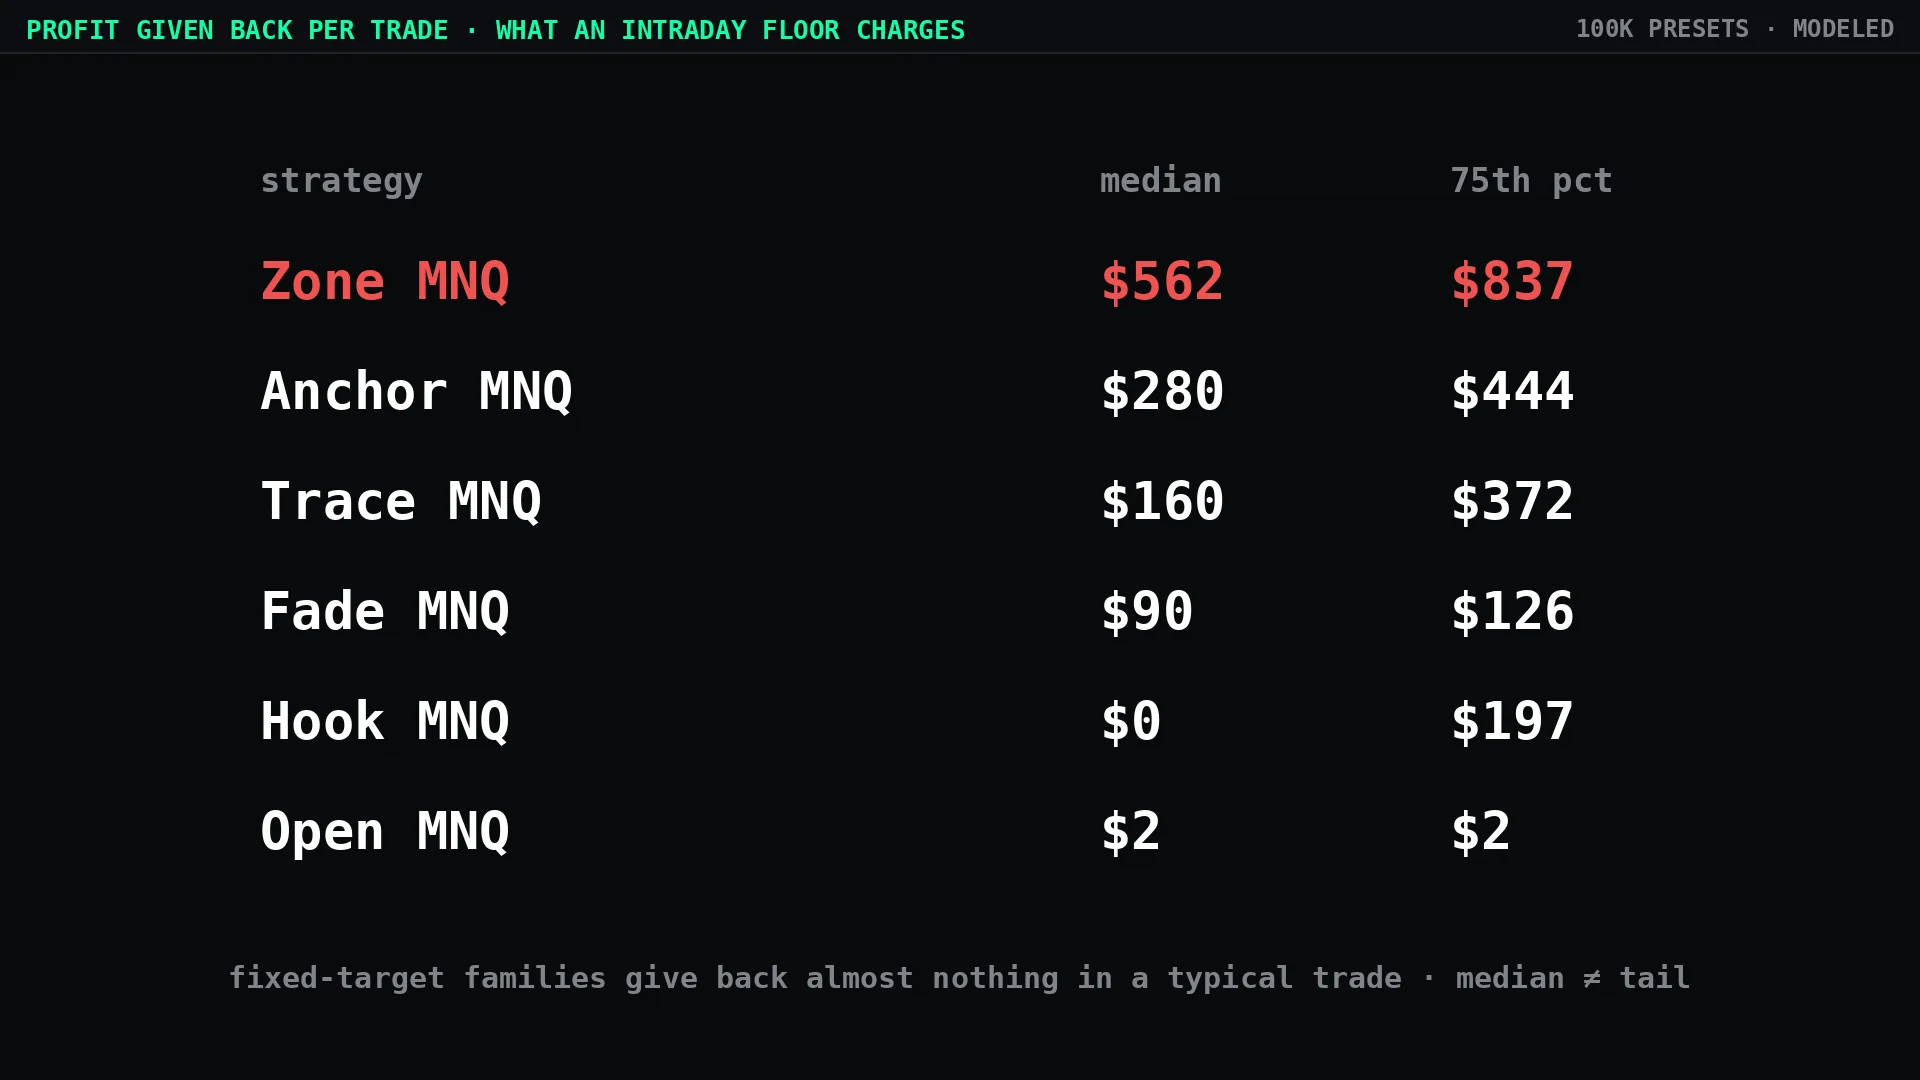
Zone on micro Nasdaq gives back a median of $562 per trade, and $837 at the 75th percentile. Anchor gives back $280. Families that exit at a fixed target — Open, Hook — give back almost nothing in a typical trade, because they take the profit and leave.
Two cautions. These are dollar figures, which is what the floor actually counts; ratios to the stop can mislead when the typical loss is small. And the median describes a typical day, not the tail — a strategy that gives back nothing on average can still have an occasional trade that gives back a lot.
Why none of our presets are built for intraday trailing
Every preset in our catalog is sized for an end-of-day floor on futures or a static floor on forex. None is built for intraday trailing, and this is the reason.
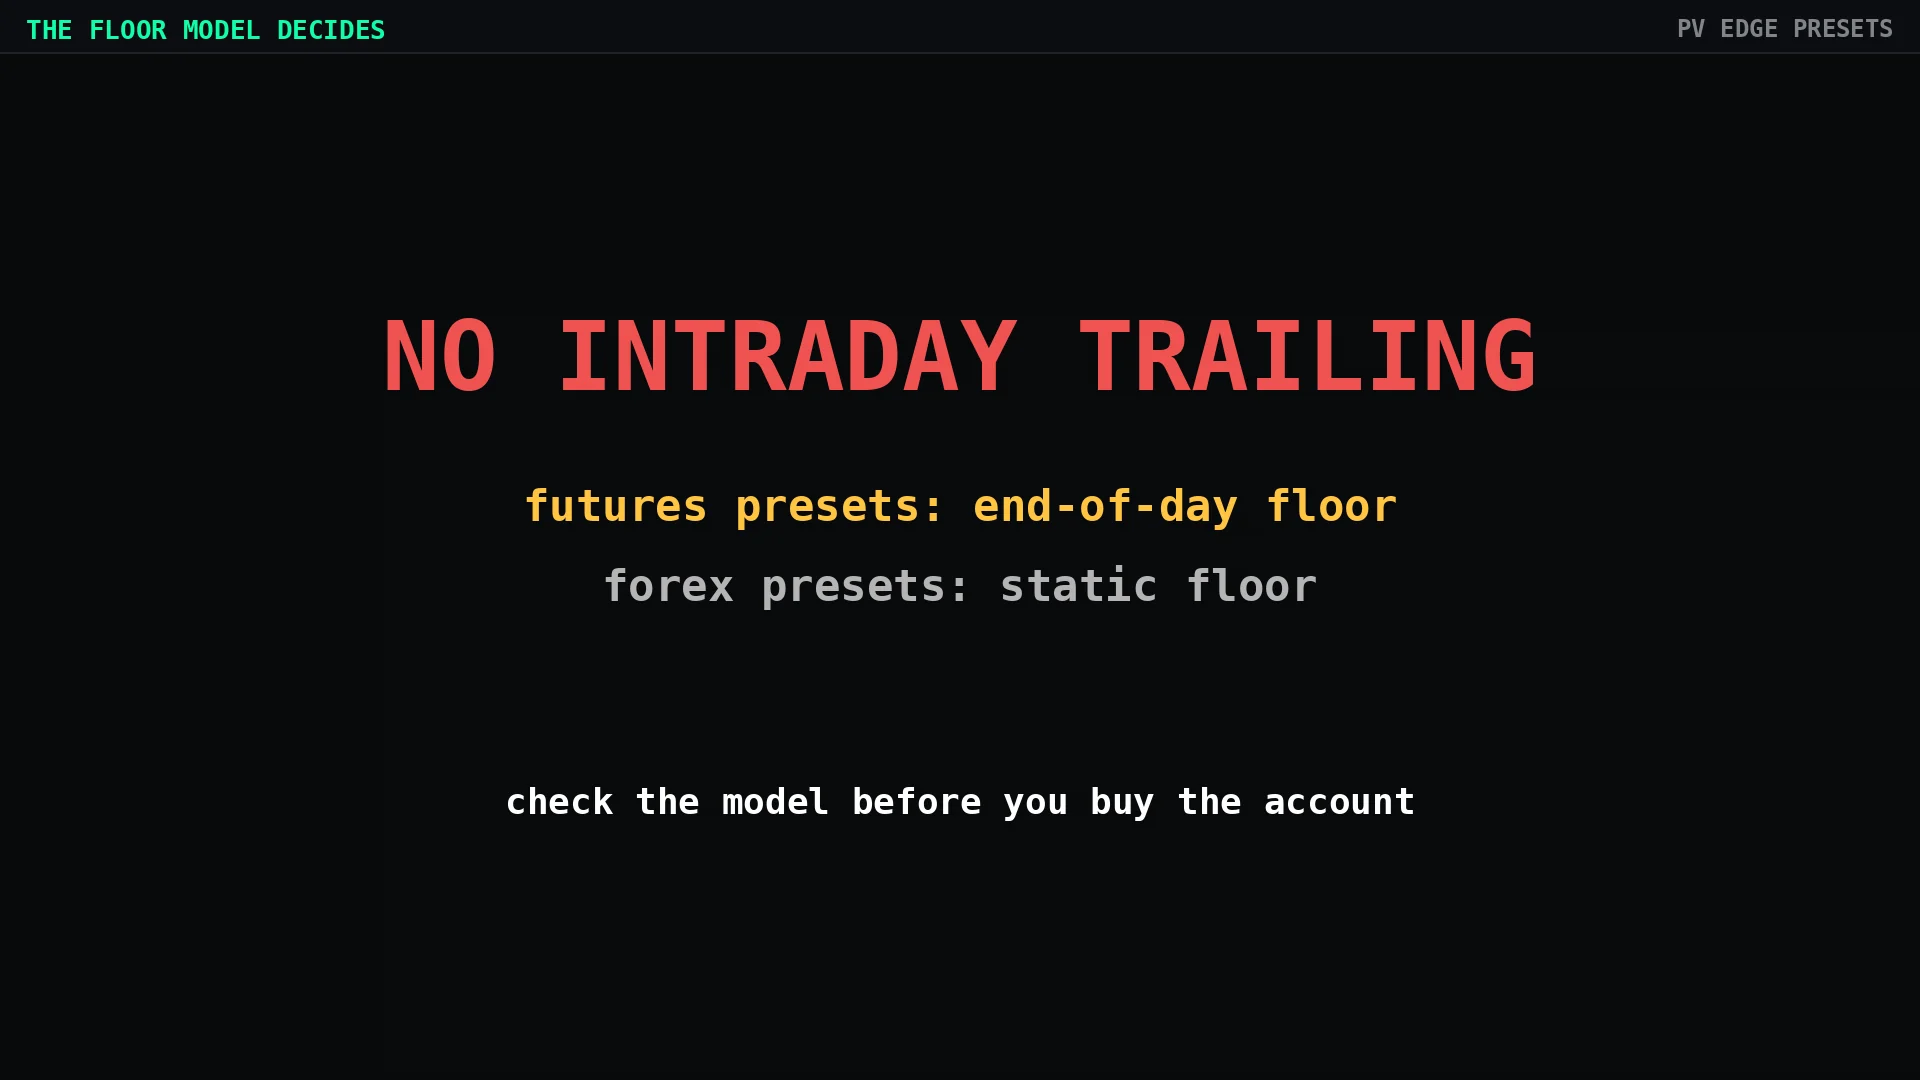
Position size in our presets is calibrated so that a normal bad stretch stays well above the floor. That calibration assumes the floor moves on closes, or not at all. On an intraday floor, the same size carries an extra, variable cost — the profit each trade gives back — and the survival numbers above no longer hold. We would rather say so than publish a preset that quietly assumes something the account does not do.
What to do before you buy an account
Check the floor model first. It is listed in the rules of every evaluation, usually in a single line, and it matters more than the profit split or the price.
If it is intraday trailing, stop measuring risk by your stop. Measure it by your stop plus what your strategy typically gives back before it exits. If you do not know that number, your trade history has it: for each trade, subtract the realized result from the maximum open profit.
The trailing drawdown visualizer lets you run the same path through all three floor models side by side, and the position size calculator sizes against the room you actually have. For the simpler version of the same mechanics, see EOD vs intraday trailing drawdown.
Methodology and limits
Trade statistics come from the exported trade record at 100K presets: modeled to 31 March 2026 and live from 1 April 2026, on the same rule sets. The worked example — Zone on MNQ, 11 June 2026 — is a live trade. Survival figures are a forecast: Monte Carlo, 1,500 simulated account lives per floor model, three years, 5-day block bootstrap, $3,000 limit, no forced withdrawals.
The intraday range reflects a real limit of trade-list data — the order of the peak and the trough inside a position is not recorded. We report the range rather than pick the flattering end of it.