What an intraday trailing drawdown actually tracks
People think an intraday trailing floor tracks their results. It tracks their peaks.
Data layers: trade statistics come from the exported trade record at 100K presets — modeled to 31 March 2026 and live from 1 April 2026, on the same rule sets. The worked example (Zone MNQ, 11 June 2026) is a live trade. Survival figures are a forecast: Monte Carlo, 1,500 simulated account lives. The layers are never blended into a single figure. Method at /methodology.
Most traders read a drawdown rule once, when they buy the account, and then trade against their memory of it. With an intraday trailing floor, that memory is usually wrong in one specific way: people think it tracks their results. It tracks their peaks.
Three models in three sentences
A static drawdown floor sits at a fixed level below your starting balance and never moves.
An end-of-day trailing floor follows your balance upward, but only using the closing value of each trading day.
An intraday trailing floor follows your equity upward in real time, including profit on positions that are still open.
The difference between the last two sounds technical. In practice it decides whether a flat day costs you anything.
One worked example
Take an account with a $3,000 drawdown limit, at its high. You open a position. It moves in your favour and shows $1,500 of unrealized profit. Then it reverses and you close it at break-even.
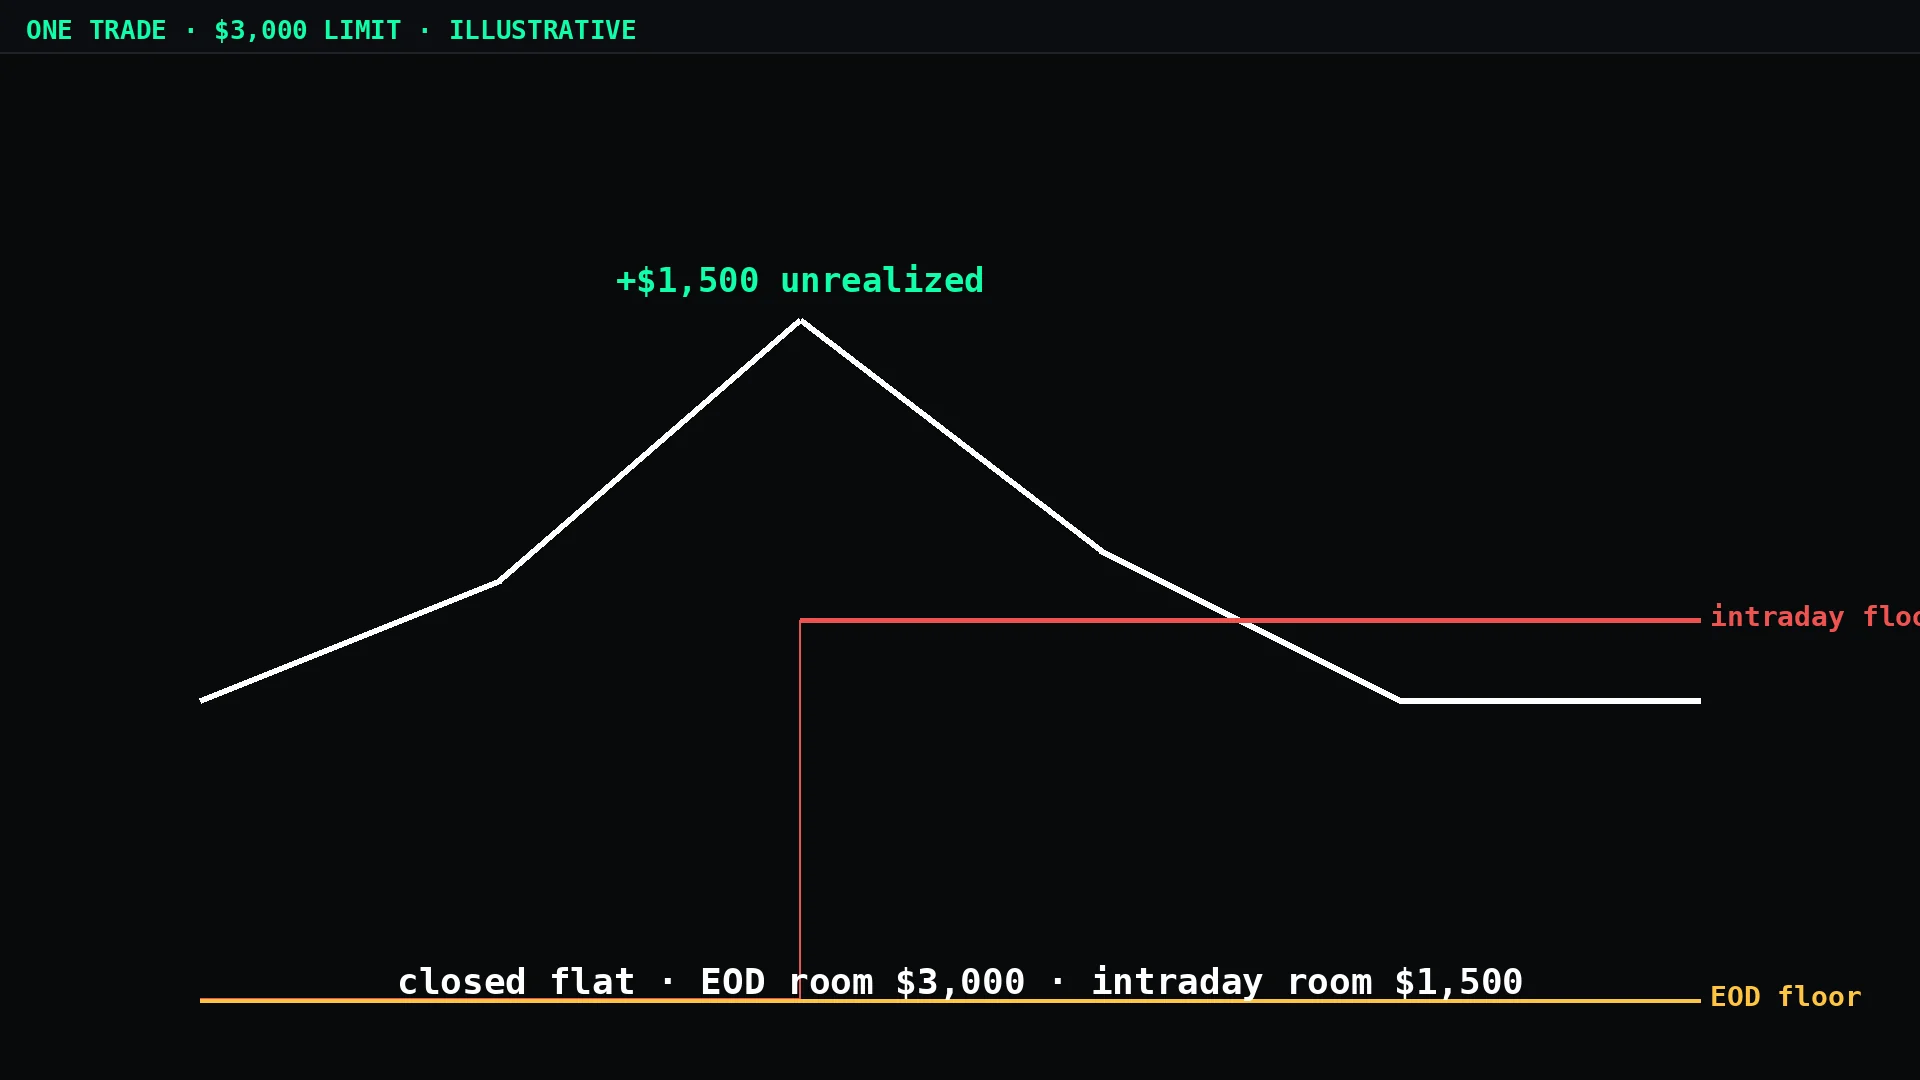
On an end-of-day floor, nothing happened. The day closed flat, the closing balance set no new high, the floor did not move. You still have $3,000 of room.
On an intraday floor, the floor rose $1,500 when the position peaked. It does not come back down when the position does. You closed flat, and you now have $1,500 of room.
Nothing about your close matters here. The floor had already moved before you closed.
Why this catches experienced traders
Two habits that are sensible on other account types become expensive on intraday trailing.
Letting winners run is the first. A position that runs far and then retraces to a modest gain raises the floor by the full run and banks only the modest gain. The better the trade looked at its best, the more room it cost.
Reading the daily P&L is the second. On an intraday account, the day can end green and the account can still be finished, because the level that ended it was touched between the peak and the close. That event never shows up in an end-of-day statement.
Two questions before you buy the account
Which floor model does it use? It is usually one line in the rules, and it matters more than the price.
If it is intraday, how much does your strategy give back before it exits? Your trade history has the answer: for each trade, subtract what you actually made from the maximum open profit you had. On an intraday floor, your real risk per trade is your stop plus that number.
We ran the same question across a full portfolio and 1,500 simulated account lives — the complete breakdown, with one real trade and the survival numbers for all three models, is here. To see the three floors move on the same path, use the trailing drawdown visualizer.