We Forecast Our Prop Strategy Results Before Going Live — the Scorecard
In April 2026, before putting real funded accounts behind it, our Monte Carlo model forecast a median $41,012 net per year, a top-decile ceiling of $49,950, and 0.00% blown accounts for the Forex Champion portfolio on a 100K preset. Four live months later the account shows $31,094 net and zero breaches. Set next to the forecast — modeled and live labeled separately — those four months came in above even the model’s top decile. This is the full scorecard, including the part that went wrong on schedule.
Anyone can publish a backtest. The only way a model earns trust is the uncomfortable way: state the forecast in public, then let live trading grade it. That’s what the last four months were.
What exactly did the model predict?
The forecast wasn’t a single number. Before live launch, 1,500 simulated account lifecycles — built from twelve months of daily P&L, with the account’s drawdown floor enforced and every payout deducted along the path — produced a distribution:
| FORECAST · modeled, locked before live | Value |
|---|---|
| Median net / year | $41,012 |
| Median, four-month share | $13,671 |
| Bottom decile (P10) / year | $32,284 |
| Top decile (P90) / year | $49,950 |
| Blown accounts / year | 0.00% (1,500:0 paths) |
| Median time to first payout | 41 days |
Publishing the P10 mattered as much as the median. A forecast without a bad tail isn’t a forecast — it’s an ad.
What did four live months deliver?
April through July 2026, on real funded accounts, every number net of costs:
| DELIVERED · live, Apr–Jul 2026 | Value |
|---|---|
| Net, four months | $31,094 |
| Red months | 0 of 4 |
| Account breaches | 0 |
| Deepest drawdown — and held | $5,245 |
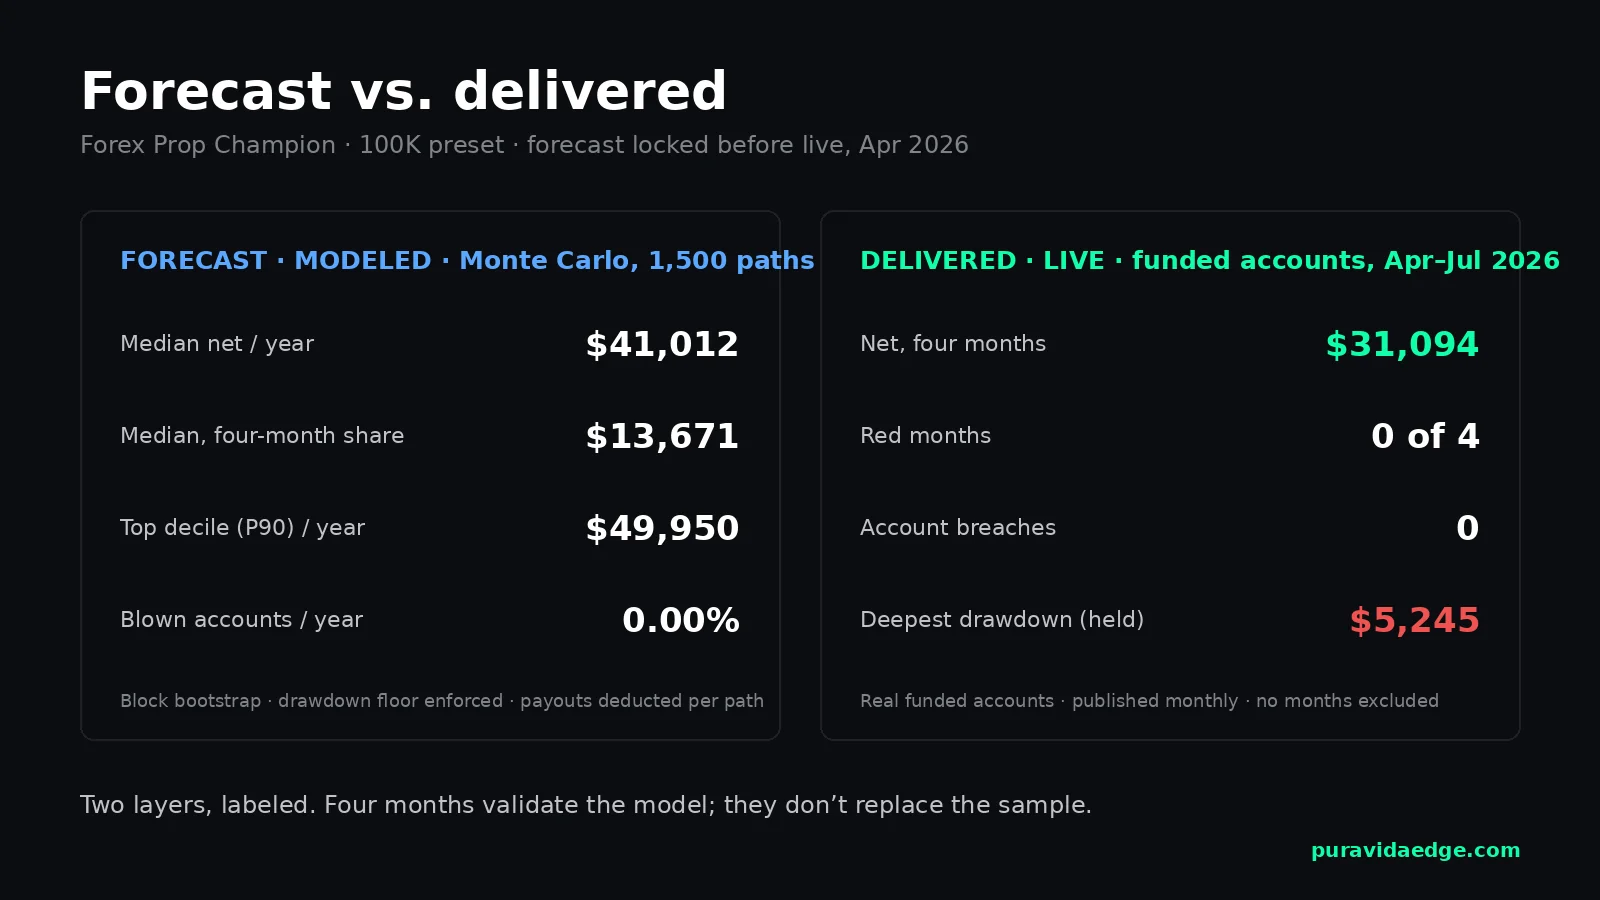
Read the two tables against each other and the comparison makes itself: the modeled median’s four-month share is $13,671; the live four months delivered $31,094. Above the top decile of the forecast. Two honest footnotes belong next to that. First, four months validate a model; they don’t replace the sample — a strong stretch proves less than sellers want you to believe — the same logic behind how payout frequency is actually measured. Second, running above P90 is not the expectation going forward; reversion toward the median is what the model itself predicts.
The part that went wrong — on schedule
The deepest drawdown of the entire sixteen-month dataset, $5,245, did not happen in the comfortable backtest period. It happened in June 2026, live, with real money on funded accounts.
Nothing was adjusted. No stop was moved, no position trimmed, no “temporary pause to reassess.” The exits were written into the orders before the positions existed, so there was nothing left for a human to second-guess — and the same quarter that contained the worst drawdown closed at +$24,118. The model had priced streaks of that depth into every one of its 1,500 paths; watching one arrive and pass through was the system doing precisely what it was simulated to do.
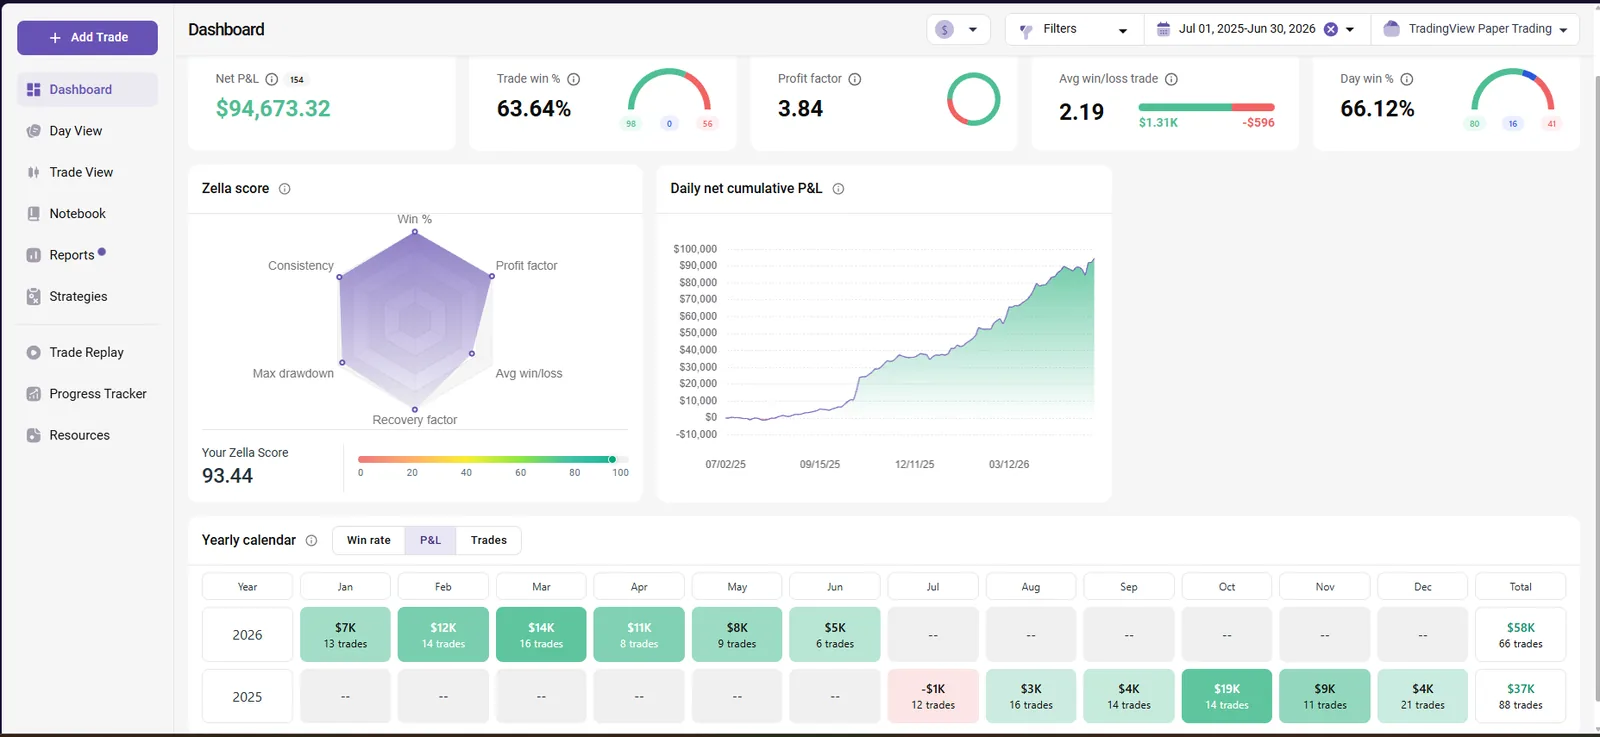
One month in the sixteen-month window is red (July 2025, −$1,344). It stays in every chart we publish, because a track record you only see when it flatters the seller isn’t a track record.
Why the forecast is lower than the backtest — and why that’s the point
The trailing twelve months show $92,794. The model’s median says $41,012. That gap isn’t an error; it’s the difference between a curve and a life. The simulation deducts payouts as they happen, enforces the drawdown floor after each one, and randomly drops a quarter of trades from every path. It models an account the way an account actually gets used — which is why its number is the one we put on the pricing page, and the bigger one is context.
If a vendor shows you only the bigger number, ask what happened to the floor, the withdrawals, and the missed trades. There is always an answer; it’s just usually not published.
Check it yourself
Every figure above sits on the Forex Champion page, refreshed monthly, live and modeled layers labeled separately — and the same three-layer breakdown exists for all twelve portfolio configurations, futures and forex.
Reproduce the Strategy Tester output on your own charts — every purchase carries a 14-day guarantee counted from the day access is granted, and if what you get doesn’t match the published specification, you get your money back.
Every Lifetime tier can be paid in 12 monthly instalments — full access from the first payment. Details on the pricing page.
Forecast figures locked April 2026; live figures through 31 July 2026, verified August 2026. Modeled results are Monte Carlo output, not a promise of future performance. Past performance does not guarantee future results.
Rules cards for every major firm →
Passing is sizing. The Playbook has the sizes.
Every portfolio configuration with the drawdown it is sized for, so the rules you just read map to a preset. One PDF, then our letters with what the systems did.
By email, from Puerto Viejo, Costa Rica. Unsubscribe anytime.