The strategies made more live than they did in the backtest
July 2026 closed at +$27,277 net across all 24 strategy-instrument pairs — the fourth consecutive green month since going live in April, and running ahead of the modeled result. The full month is below, including the three families that lost money in it.
Live results. July figures are live-tracked on real prop accounts at 100K presets, after commission and slippage. Backtest comparisons cover the twelve months prior. Four months of live trading is not a basis for annualized claims.
July 2026 closed at +$27,277 net across all 24 strategy-instrument pairs at 100K presets, after commission and slippage — the fourth consecutive green month since going live in April. Four months in, the live average sits at $32.4K per month against the backtest's $24.7K, which is the opposite of what almost everyone assumes about the backtest-to-live transition. The full month is below, including the three strategy families that lost money in it.
Watch page with full transcript →
Prefer reading? The full breakdown continues below.
What did July close at?
| Metric | Value |
|---|---|
| Net result (July, live) | +$27,277 |
| Trades | 108 |
| Weighted win rate | 50.0% |
| Strategy-instrument pairs green | 16 of 24 |
| Trading days | 25 (13 green / 12 red) |
| Best day | Jul 16: +$8,941 |
| Worst day | Jul 27: −$2,997 |
| Max drawdown, EOD, all-in basket | $3,170 |
| Best single trade | +$2,474 |
| Worst single trade | −$3,493 |
All figures live, at 100K presets, net of costs. Half the days were red and the month still finished at +$27K — that ratio is worth sitting with, because it's what a functioning systematic month actually looks like from the inside.
How does live compare to the backtest after four months?
The cumulative picture: twelve months of backtest produced $297K ($24.7K per month); four months of live trading have added $130K ($32.4K per month), for $426K total on the combined curve. The live segment is running about 31% ahead of the modeled monthly result.
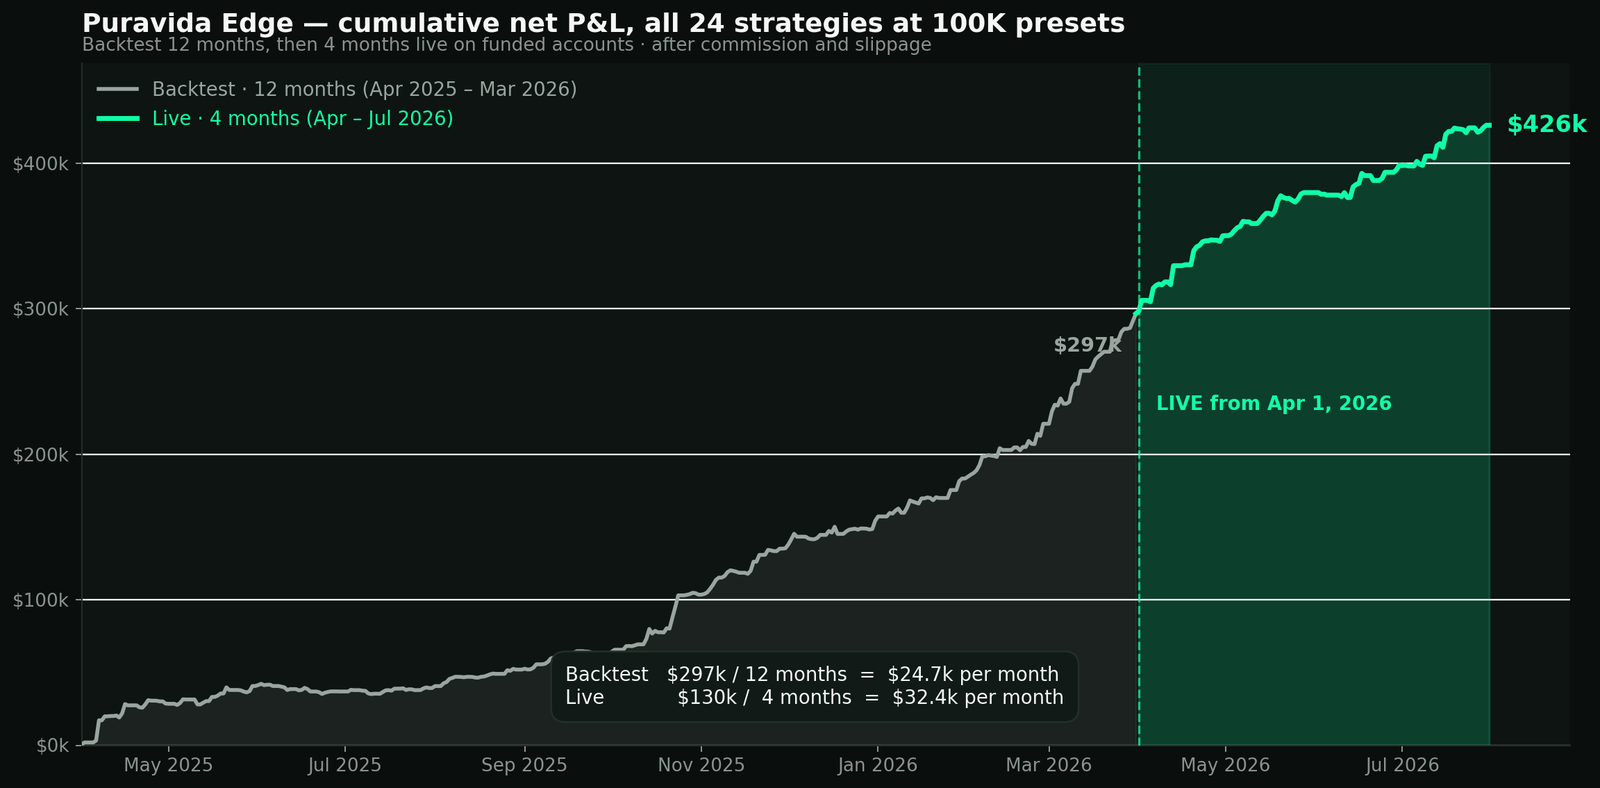
Two honest caveats before anyone extrapolates. First, four months is a sample, not a verdict — we treat the live average as an observation, and the backtest average as the planning number, until the live window is much longer. Second, as of this refresh every figure we publish — backtest and live alike — includes commission and slippage modeled into each trade. Numbers across the site are lower than in earlier publications because of it, and that's deliberate: the conservative estimate should be conservative all the way down.
What carried the month?
Two families delivered roughly 85% of July's result:
| Family | July (live) | vs 4-quarter avg |
|---|---|---|
| Anchor | +$11,729 | 282% |
| Zone | +$11,598 | debut month |
| Pivot | +$1,405 | 151% |
| Trace | +$3,536 | 54% |
| Reject | +$550 | 46% |
| Open | −$333 | — |
| GAP | −$773 | — |
| Hook | −$436 | — |
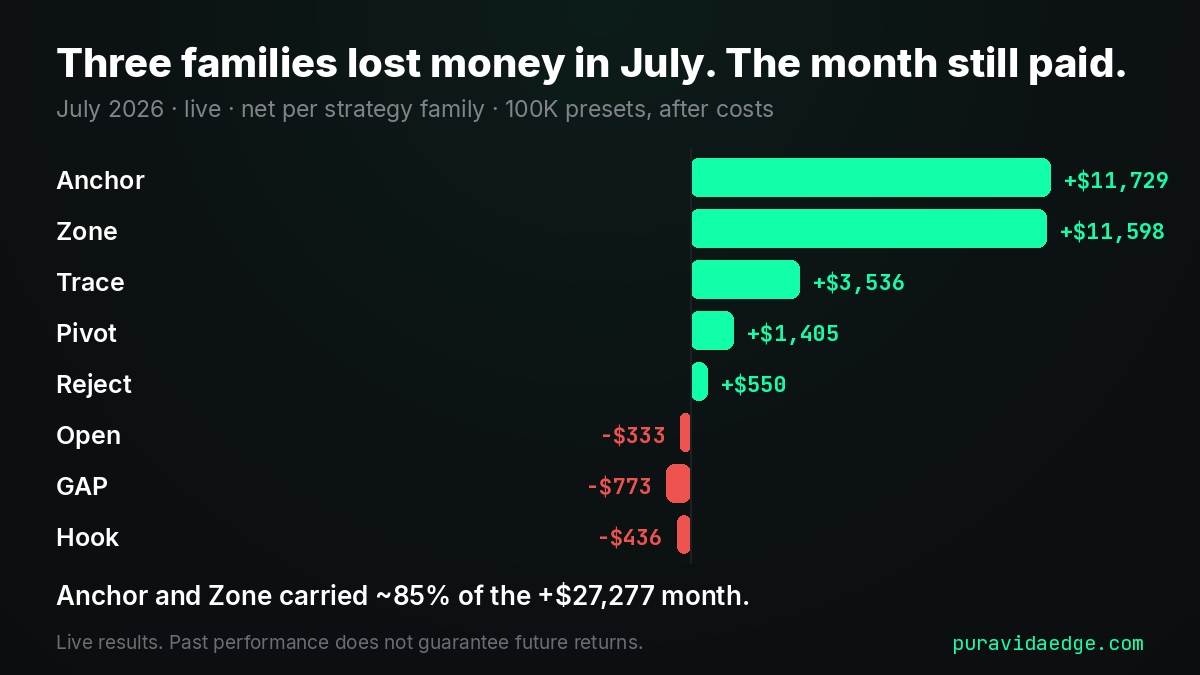
Three families finished the month in the red, and the month didn't care. That is not a lucky accident — it's the mechanism the lineup is built around: families with different triggers go quiet or negative in different conditions, and the ones whose conditions are present carry the period. July was Anchor's and Zone's month; in Q1 it was GAP's and Open's. Nobody has to predict whose month it will be, because nothing in the execution depends on knowing.
Zone deserves its own note: first live month, +$11,598, green on all four instruments, second-best family on the book in its debut. The full introduction — what it trades and why its trade count is deliberately low — is in the Zone write-up, and the specification lives on the strategy page.
How normal is a below-average month?
July came in at 90% of the trailing four-quarter monthly average. The dispersion underneath it is the more useful number: NAS finished at 162% of its average, MGC at 33% — the same families, running the same logic, on different markets in the same month. That spread is ordinary, and it's the reason per-instrument months are not a report card.
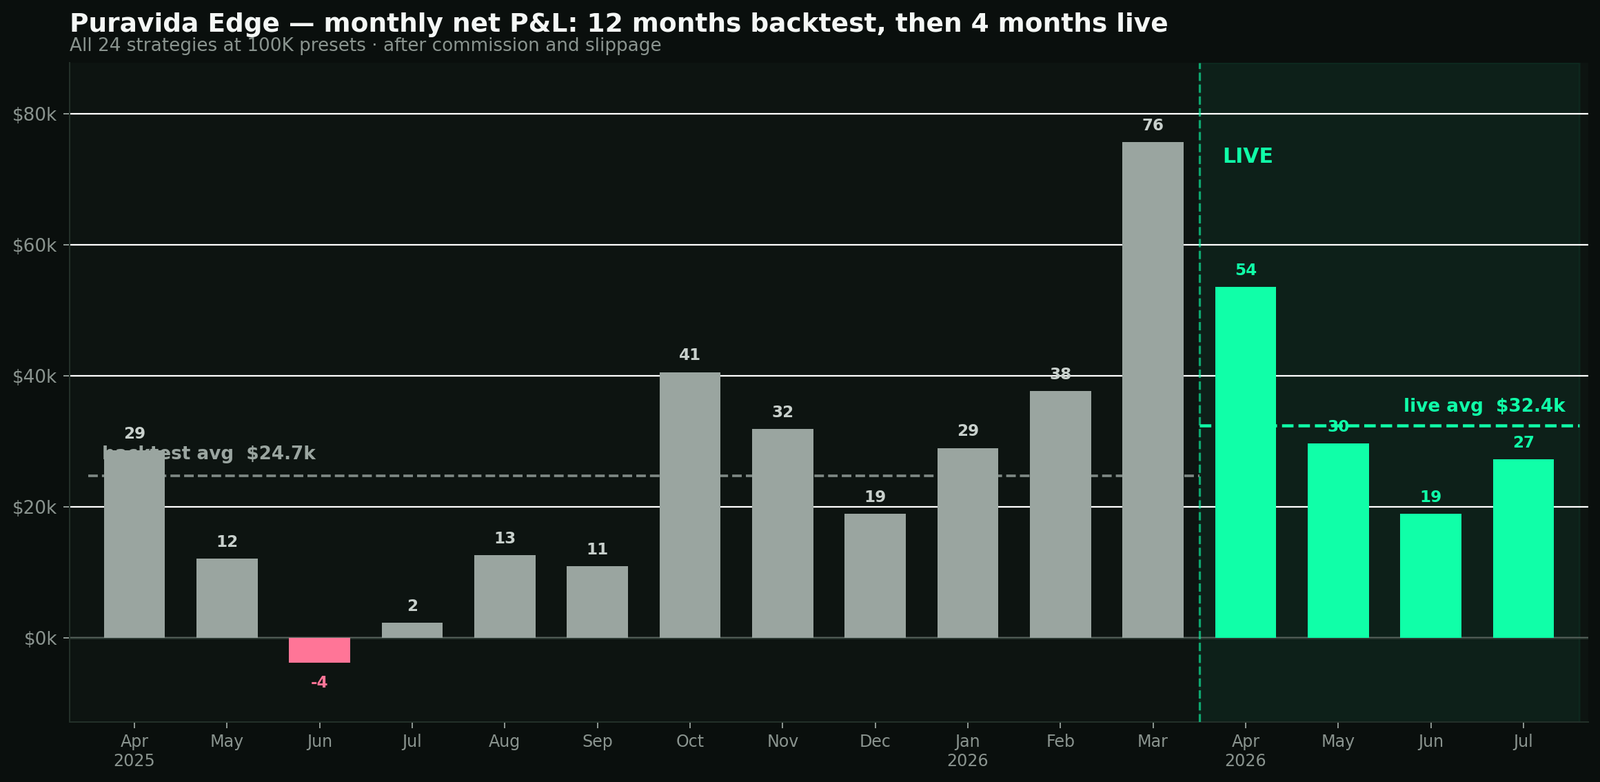
We publish months like this with the same detail as the record ones, because a track record that only has good months in it isn't a track record — it's a highlight reel. The benchmark we hold months against is the trailing four-quarter average, not the best quarter on the curve.
Did the portfolios hold up?
Same pattern, one level up. Of the twelve portfolio compositions, nine finished July green:
| Portfolio | July (live) |
|---|---|
| 50K Balanced | +$185 |
| 50K Growth | +$2,343 |
| 50K Precision | −$282 |
| 100K Balanced | +$2,455 |
| 100K Growth | +$4,074 |
| 100K Precision | −$2,709 |
| 150K Balanced | +$4,686 |
| 150K Growth | +$5,919 |
| 150K Precision | −$4,112 |
| Forex Champion | +$6,976 |
| Forex Focus | +$2,769 |
| Forex Index | +$4,286 |
The three that finished red share one profile: Precision concentrates the families that had their quiet month — GAP, Hook and Open. That's not a portfolio failing; that's a portfolio doing exactly what its composition says it will do when those particular conditions are absent. Even the portfolios rotate. Compositions per account tier are on the portfolios page.
Best and worst pairs
| # | Pair | Trades | Net (live) | WR |
|---|---|---|---|---|
| 1 | Anchor NAS | 8 | +$7,111 | 100% |
| 2 | Zone MNQ | 9 | +$6,768 | 44% |
| 3 | Trace NAS | 15 | +$5,741 | 40% |
| 4 | Anchor MNQ | 6 | +$4,618 | 100% |
| 5 | Zone NAS | 9 | +$2,482 | 33% |
At the other end: Trace MNQ (−$2,901, 0% WR on 8 trades), GAP MNQ (−$1,750), Open NAS (−$1,119). Pivot MGC generated no signal at all in July — its last trade was June 5, and a selective strategy producing nothing for weeks is inside its design, not outside it. Note the win-rate spread in the top five alone: 100% next to 33%, both profitable — a live illustration of why win rate on its own is the wrong number to grade a strategy by.
What happens next
August is running on the same book, published the same way, and Q3 closes at the end of September on the quarterly standard.
All results at 100K presets, after commission and slippage. Live period: April 1 – July 31, 2026; backtest period: the twelve months prior. Results at other tiers scale with preset quantities and are not “your results”. Four months of live trading is not a basis for annualized claims. Past performance does not guarantee future returns. Trading futures and CFDs carries substantial risk of loss. Not financial advice.
Want the full picture, including the actual payout proof and how it's validated? It's in the playbook for prop traders.
Get the Playbook →Not financial advice. Performance figures across this site are a combination of live-tracked and modeled results. Past performance does not guarantee future results.