Stabilizer or engine? Reading a strategy’s risk profile before it touches a funded account
Every vendor ranks strategies by return. Almost nobody ranks them by the probability of losing the account.
Data layers: modeled figures come from the trailing twelve months (Sep 2025 – Aug 2026) at the stated account preset · live figures are tracked separately since April 2026 · Monte Carlo: 1,500 paths × 3-year horizon. Layers are never blended.
Every vendor ranks strategies by return. Almost nobody ranks them by the probability of losing the account — which on a funded account is the number that actually ends the relationship. When we rank all 29 strategy-instrument combinations in our catalog by both lists, the two orders barely resemble each other. This post is about reading the second list.
Two rankings, two jobs
Income rank answers: how much does this add to the account in a normal year? Risk rank answers: how likely is this to breach the drawdown limit, and how deep does it dig before it recovers? A strategy can be mid-table on the first and first on the second — and that combination has a specific job in a basket. It is not the engine. It is the stabilizer.
Three numbers that make up the risk profile
Blow rate. In our methodology every strategy runs through 1,500 simulated account lives — evaluation, funding, payouts deducted as they happen, drawdown floor re-enforced after every withdrawal, a quarter of trades randomly dropped. The share of lives that end in a breach is the blow rate. Zero is rare; under 1% is good; anything in double digits is a strategy that needs a partner.
Maximum drawdown, EOD basis. Not the intrabar excursion — the end-of-day figure that prop firms actually measure against your limit. Read it as a fraction of the hard drawdown on the preset, not as a dollar amount alone.
Trade frequency. This one cuts both ways. Fewer trades means less exposure and fewer chances to breach — and slower statistics, longer quiet stretches, and a daily-consistency profile that some firms score against you. Thirty trades a year is a very different account experience from three hundred.
A worked example
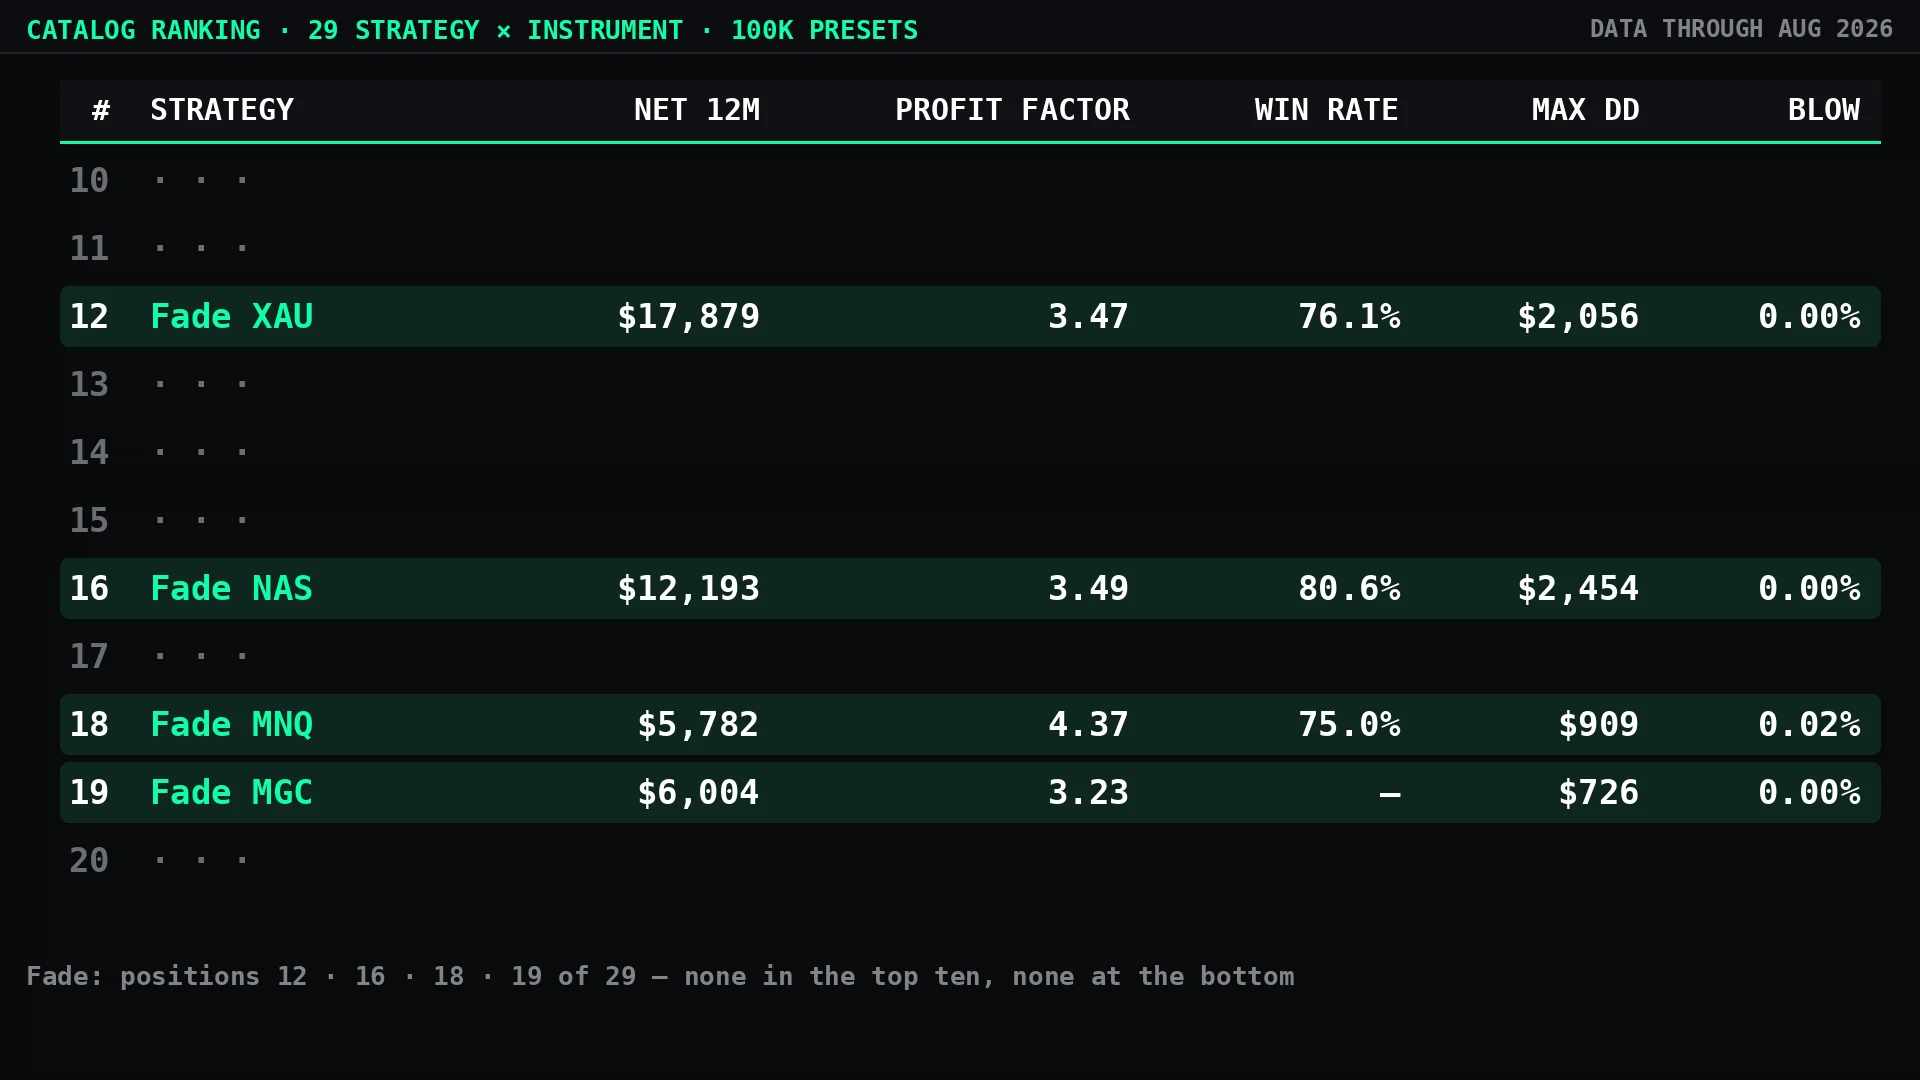
Fade, our ninth family, ranks #12, #16, #18 and #19 of 29 on trailing net at 100K presets. On the risk list it ranks first: 0.00% blow rate on three of four instruments, 0.02% on the fourth, and the two lowest futures drawdowns in the catalog (MGC $726, MNQ $909, EOD basis). Profit factor 3.2–4.4 on every instrument.
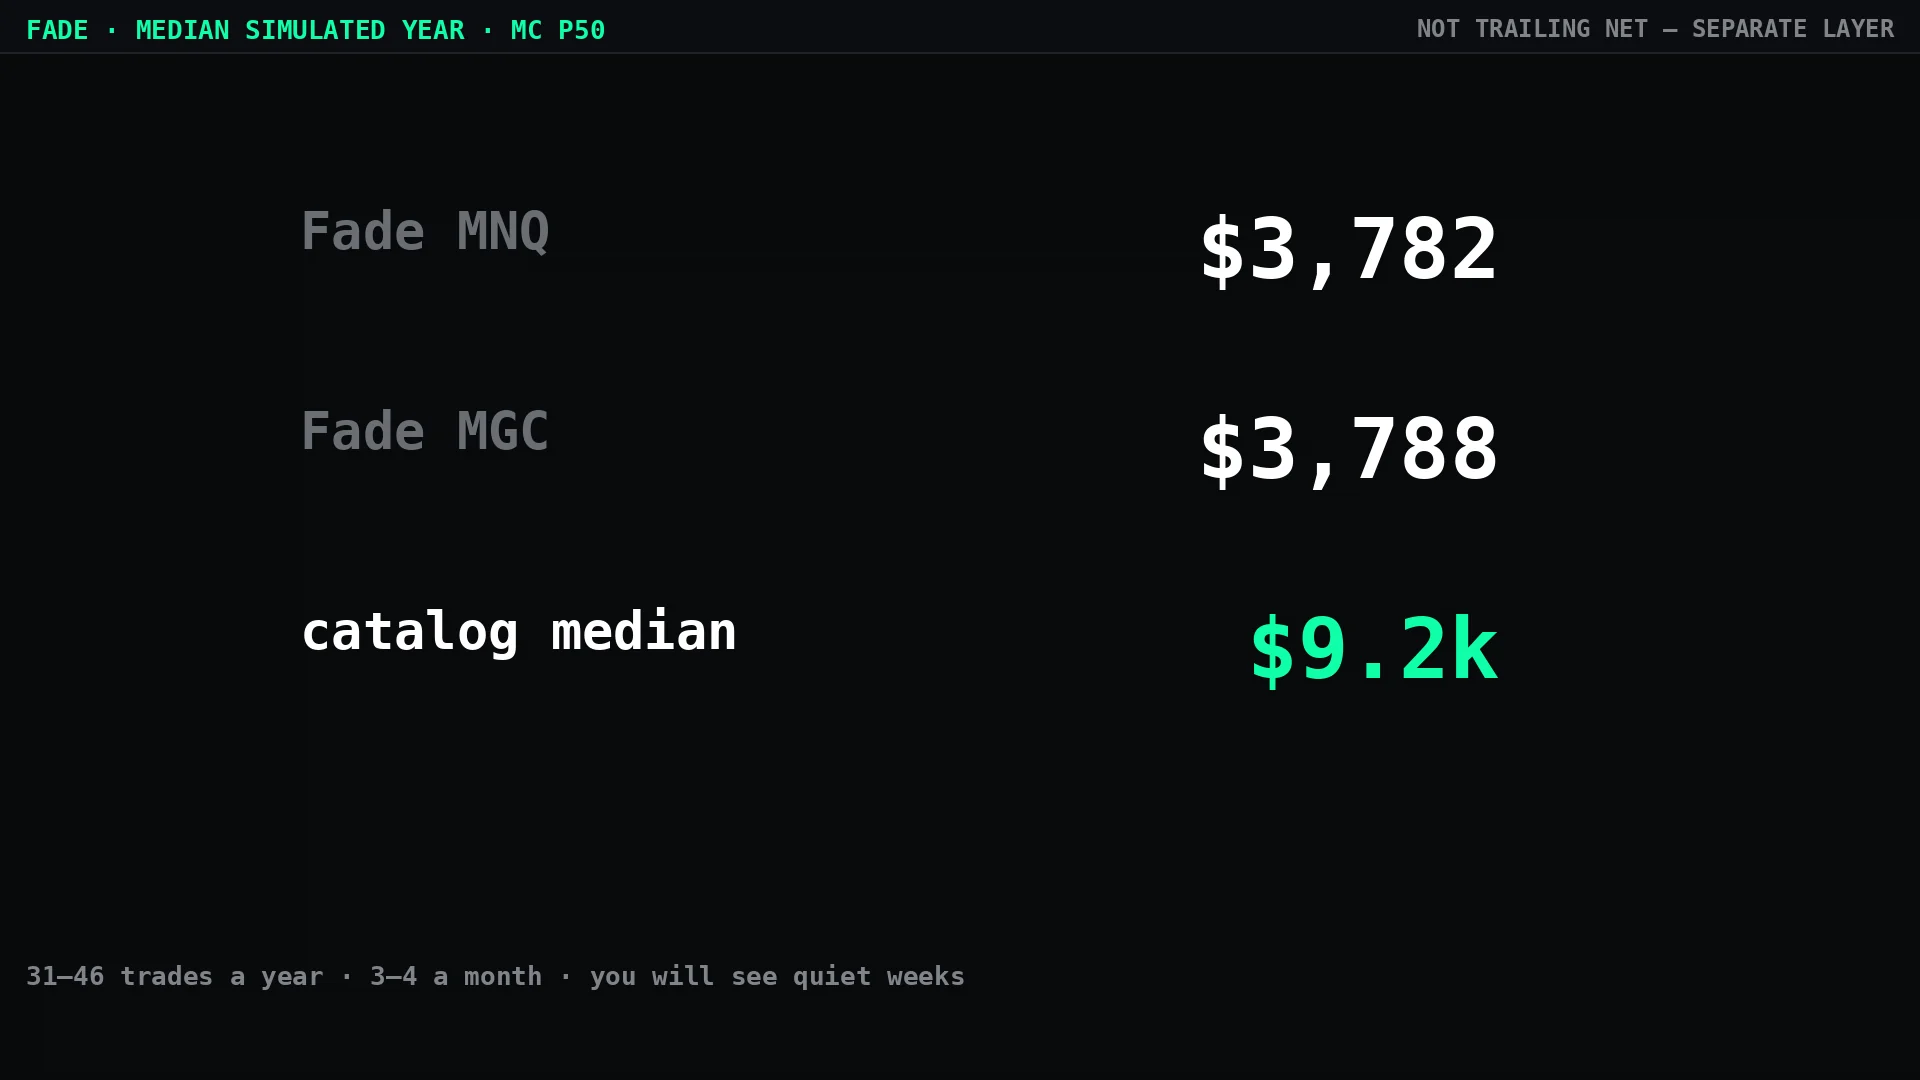
The trade-off is written in the median simulated year: under $4,000 on the futures instruments at the 100K preset, against a catalog median over $9,000 — a separate Monte Carlo layer, not the trailing net. Thirty to forty-five trades a year. Quiet weeks.
Where a stabilizer belongs
Not alone. A strategy with this profile earns its keep next to an engine — a higher-income, higher-variance family on the same account — where its trades interleave with the engine’s and flatten the account-level curve. Our portfolios are built exactly this way: individual signal sources, one instrument and one logic each, combined per account and reviewed on a quarterly cycle. Fade is not in a published composition yet; it is a candidate for the next review.
How to run the check yourself
Before adding any strategy to a funded account, ask the vendor for three things: the blow rate from a lifecycle simulation, the EOD maximum drawdown at your preset, and the annual trade count. If they can only give you a return figure, you have the first list and none of the second. Our numbers for every family, modeled and live in separate labeled layers, are on the site and refresh monthly.
Passing is sizing. The Playbook has the sizes.
Every portfolio configuration with the drawdown it is sized for, so the rules you just read map to a preset. One PDF, then our letters with what the systems did.
By email, from Puerto Viejo, Costa Rica. Unsubscribe anytime.