What a fully automated trade actually looks like — signal to fill
Most people who ask about automated trading have never actually seen one trade happen from start to finish. They’ve seen equity curves, they’ve seen screenshots of green months, and they’ve seen a thousand promises. What they haven’t seen is the boring middle part: the moment a system decides, the order leaving the machine, and the exit taking itself while nobody is watching.
So we filmed one. A complete trade taken by Trace, one of our eight strategy families, on the Nasdaq 45-minute chart — from the signal printing to the target filling, with every timestamp visible.
Watch page with full transcript →
Prefer reading? The full anatomy continues below.
What happens at the moment of the signal?
Everything, at once. When the setup conditions are met, the strategy prints the entry, the stop-loss and the take-profit in the same instant. There is no “enter now and figure out the exit later” — the exit logic was written into the code long before this particular trade existed, so the trade arrives fully formed.
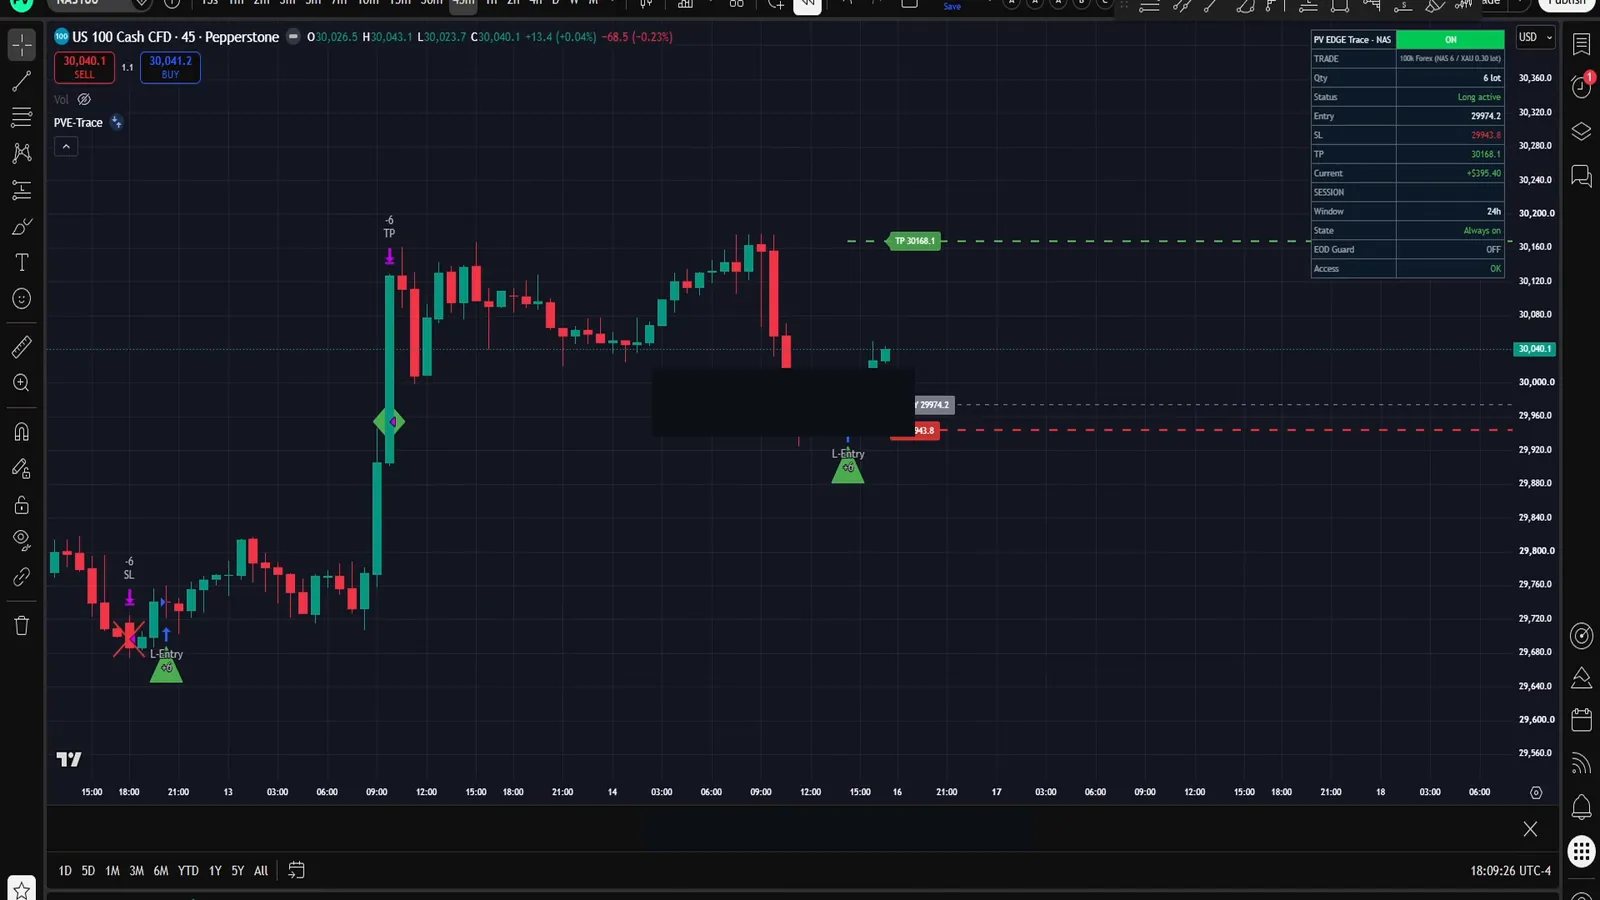
That single property separates systematic execution from most manual trading. A discretionary trader makes one decision at entry and then renegotiates it with themselves for the entire life of the position. A coded strategy makes the whole set of decisions once, in advance, and the market simply reveals which branch plays out.
How does the order actually leave the chart?
Through an alert and a webhook. At 12:15:00 the strategy fired its alert, and the webhook carried the order out to execution. Each step leaves its own record: the signal is visible on the chart, the entry appears in the alert log with a timestamp, and the delivery confirmation is logged the same minute.
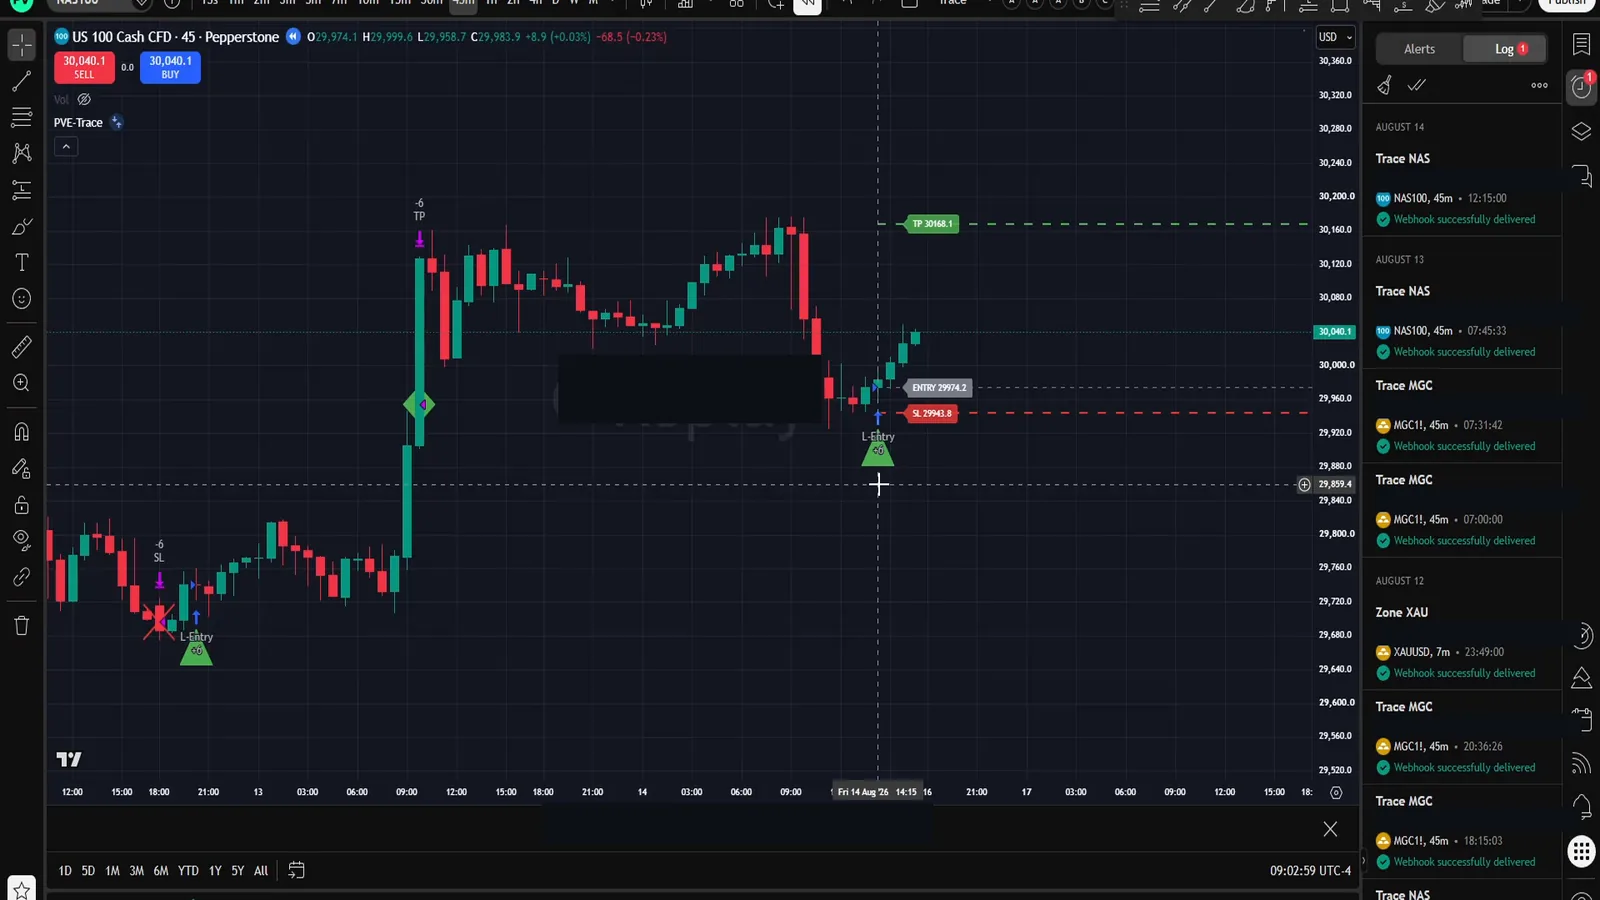
Three independent timestamps, one minute. That audit trail is worth more than any screenshot of a green month, because timestamps can be cross-checked and screenshots cannot. We wrote a separate guide on exactly that: how to verify an automated trade really happened.
What does the risk look like before the trade is a minute old?
A number. The distance to the stop multiplied by the position size equals the maximum loss, and both were fixed the moment the position opened. On this particular trade the reward-to-risk landed close to seven to one; across our setups the ratio ranges from roughly two-to-one up to seven, depending on the strategy family and conditions.
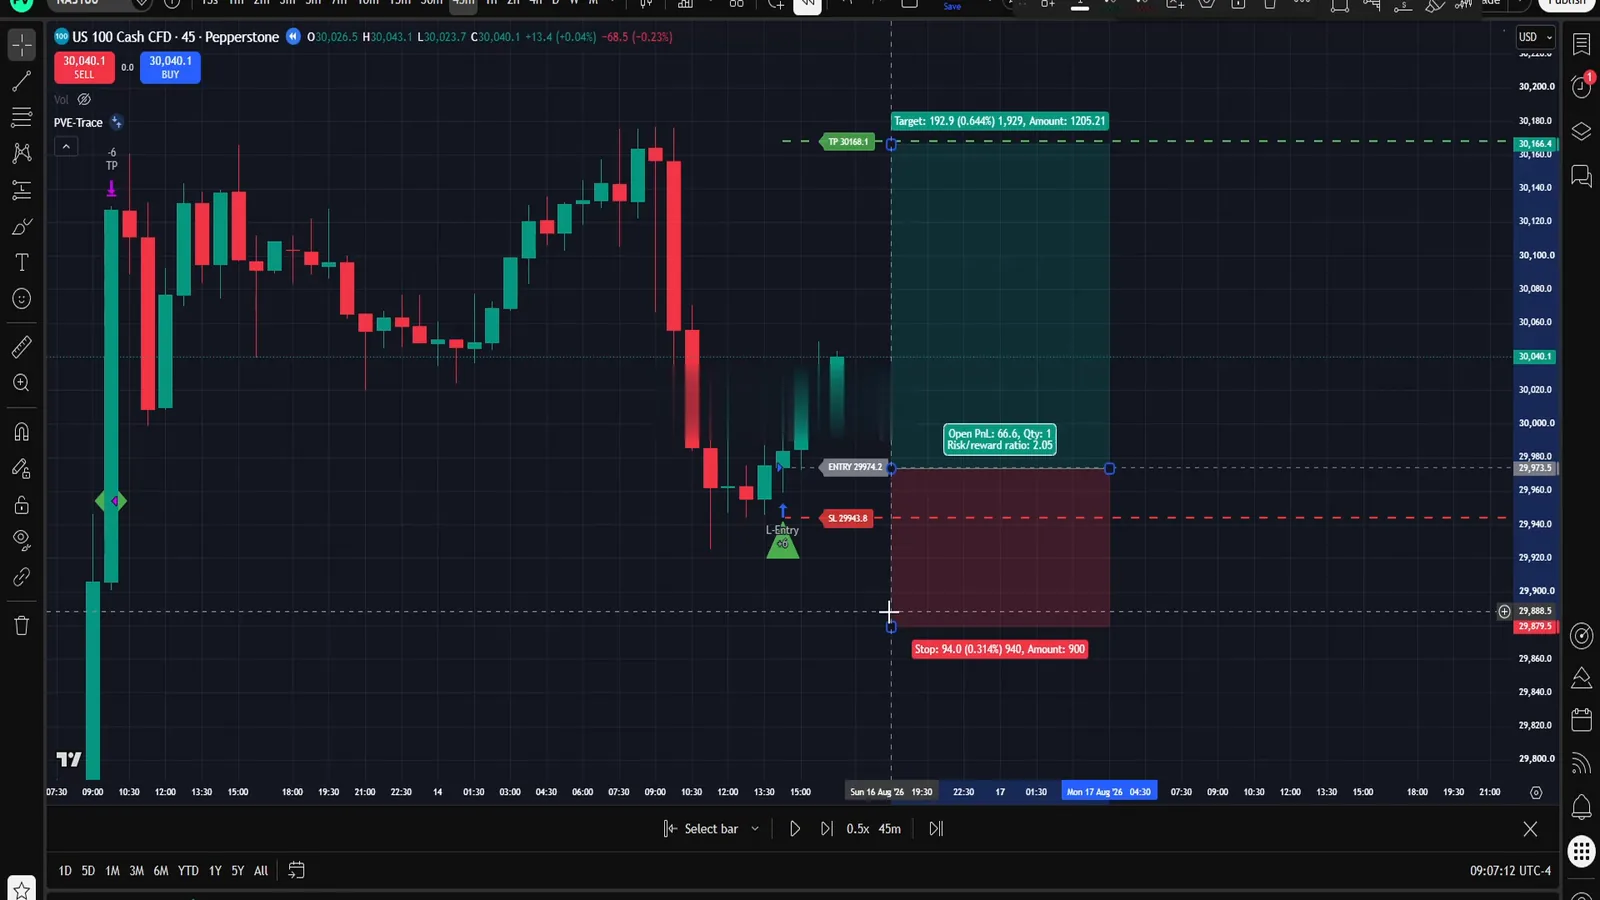
The point isn’t the specific ratio. The point is that the trade can now only end two ways, and both endings were priced before it started. Sizing against the account’s drawdown — not against the balance — is what makes that number survivable on a funded account, which is why sizing is the first thing we’d tell anyone to check with our position sizing tool.
Who watches the position while it’s open?
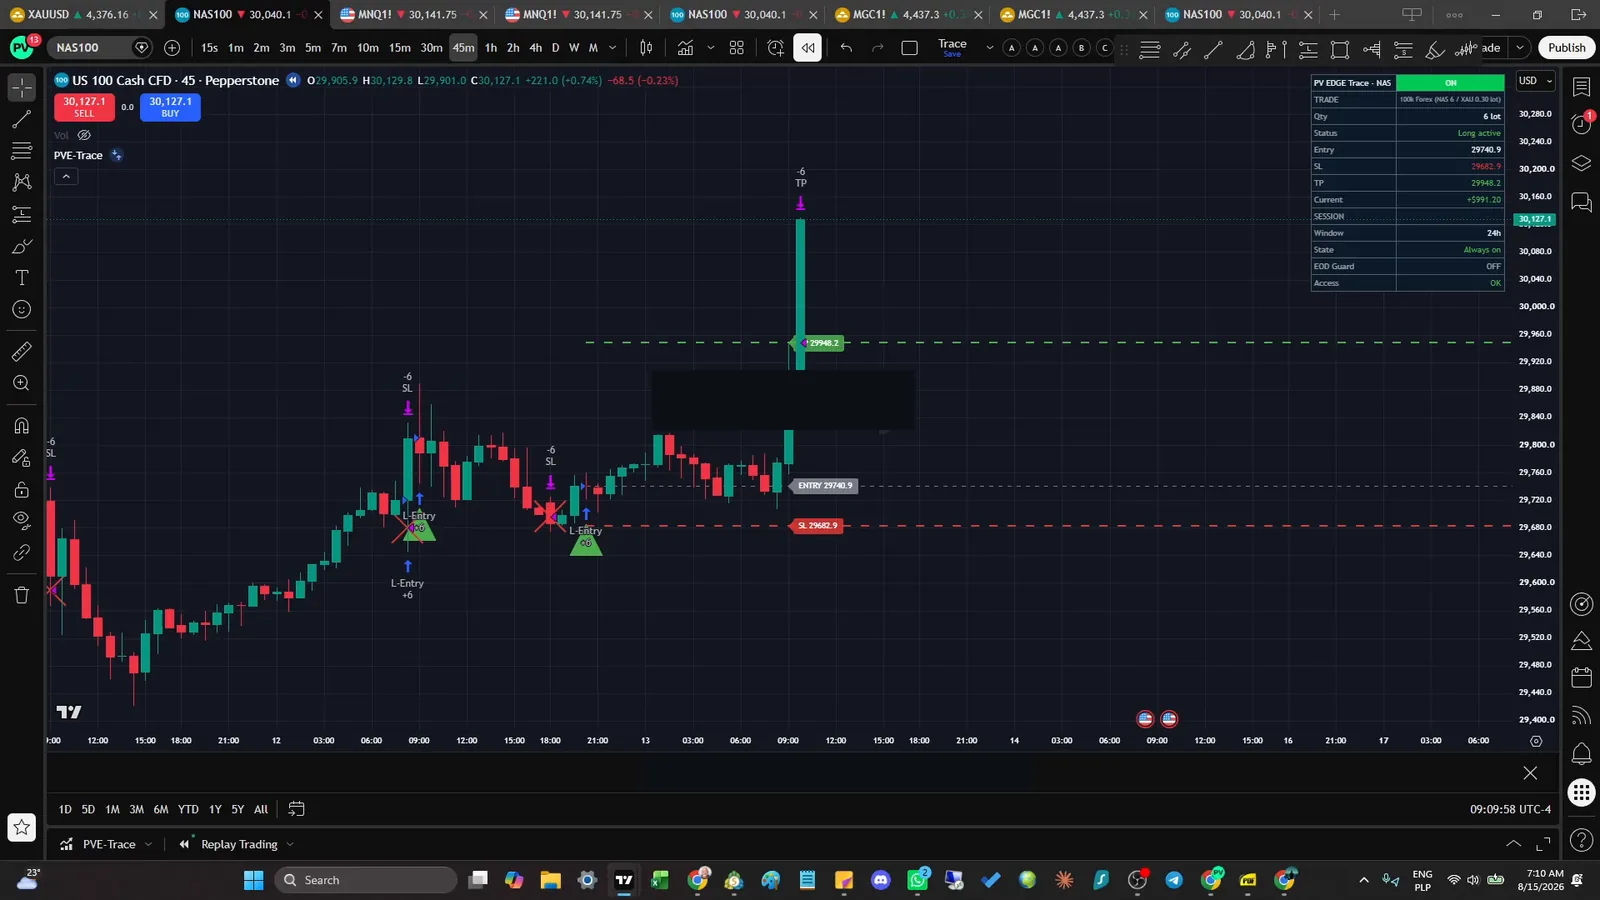
Nobody, by design. A human watching an open trade is a human tempted to touch it — move the stop, take profit early, add size. The cheapest way to not interfere is to not be there, so the position ran unattended and the target filled on its own.
Does one filled target prove the system works?
No, and it’s important to say that out loud. A filled target proves the pipeline works — signal, order, execution. It proves nothing about edge. One trade is a sample of one. The evidence lives in the published record: twelve months of backtest and five months of live results on funded accounts, red days included, in the monthly breakdowns.
This trade is just what those numbers are made of, one decision at a time.
Live trade shown for illustration. Live results from funded accounts at 100K presets, after commission and slippage. Past performance does not guarantee future returns. Trading futures and CFDs carries substantial risk of loss. Not financial advice.
See every prop firm rule, grouped by mechanism →
The systems the alerts come from.
Every strategy and portfolio that runs on TradingView, with the preset per account tier. One PDF, then our letters with what the systems did.
By email, from Puerto Viejo, Costa Rica. Unsubscribe anytime.