Total Apr 2025 – Sep 2026 · live layer = real account at the same presets since Apr 2026
GAP MGC 10 ct + Anchor MNQ 7 ct — single 150K Futures Prop account, one position per strategy.
Composition updated 1 Oct 2026. Trace MNQ 3 ct swapped for Anchor MNQ 7 ct. Previous composition until 30 Sep 2026: GAP MGC 10 ct + Trace MNQ 3 ct. The modeled and live figures on this page are from the previous composition (history is not restated); figures for the new composition accrue from October 2026.
About. 150K-Precision is the new third variant of its tier, anchored by Gap — the sparsest, highest-profit-factor strategy in the roster. Few trades, small drawdown contribution, unusually high payouts-to-blow ratio.
When to use. For traders who want maximum survivability. Blow rate near zero and the highest payouts-to-blow ratio in the tier — at the cost of fewer, larger-conviction trades. Component strategies are live; the joint portfolio track started Q2’26.
At a glance
3.19 PF · 40.0% Win rate · $4,100 Max DD (EOD) · 2.14 Sharpe
Total Apr 2025 – Sep 2026 as sized; forecast metrics: Monte Carlo, 1,500 paths, 3-year horizon, input Apr 2025 – Sep 2026. Viability 3y = % of MC paths that never hit the hard drawdown. Payout potential : blow = full payout units reached in profit per one account blow over 3y (potential, not a payout schedule). TTP = median days to first payout unit.
150K-Precision fits one account. The Playbook covers all of them.
Every portfolio configuration side by side — the figures above, the composition and the sizing per tier. One PDF, then our letters with what the systems did.
By email, from Puerto Viejo, Costa Rica. Unsubscribe anytime.
Equity curve · modeled + live
Joint daily P&L applied to the $150,000 starting balance, log scale. Gray = modeled (2025-04-01 → 2026-03-31); accent = live (2026-04-01 → 2026-09-30), right of the “LIVE →” marker. Dotted red = hard DD floor ($145,500); dotted green = eval target ($159,000).
Quarterly breakdown
Q2’25–Q1’26 modeled · live since Q2’26 (real account, through Sep 2026). Portfolio as sized (composition until 30 Sep 2026).
| Quarter | Layer | Net | WR | Trades | Max DD (EOD) |
|---|---|---|---|---|---|
| Q2'25 | modeled | +$4,522 | 41.7% | 12 | $1,994 |
| Q3'25 | modeled | −$191 | 21.1% | 19 | $1,020 |
| Q4'25 | modeled | +$3,746 | 44.4% | 18 | $1,298 |
| Q1'26 | modeled | +$15,807 | 66.7% | 12 | $976 |
| Q2'26 live | live | +$21,548 | 45.0% | 20 | $2,550 |
| Q3'26 live | live | −$1,136 | 28.6% | 14 | $2,900 |
What's running · from 1 Oct 2026
| Strategy | Qty | Role |
|---|---|---|
| GAP MGC | 10 ct | standalone |
| Anchor MNQ | 7 ct | standalone |
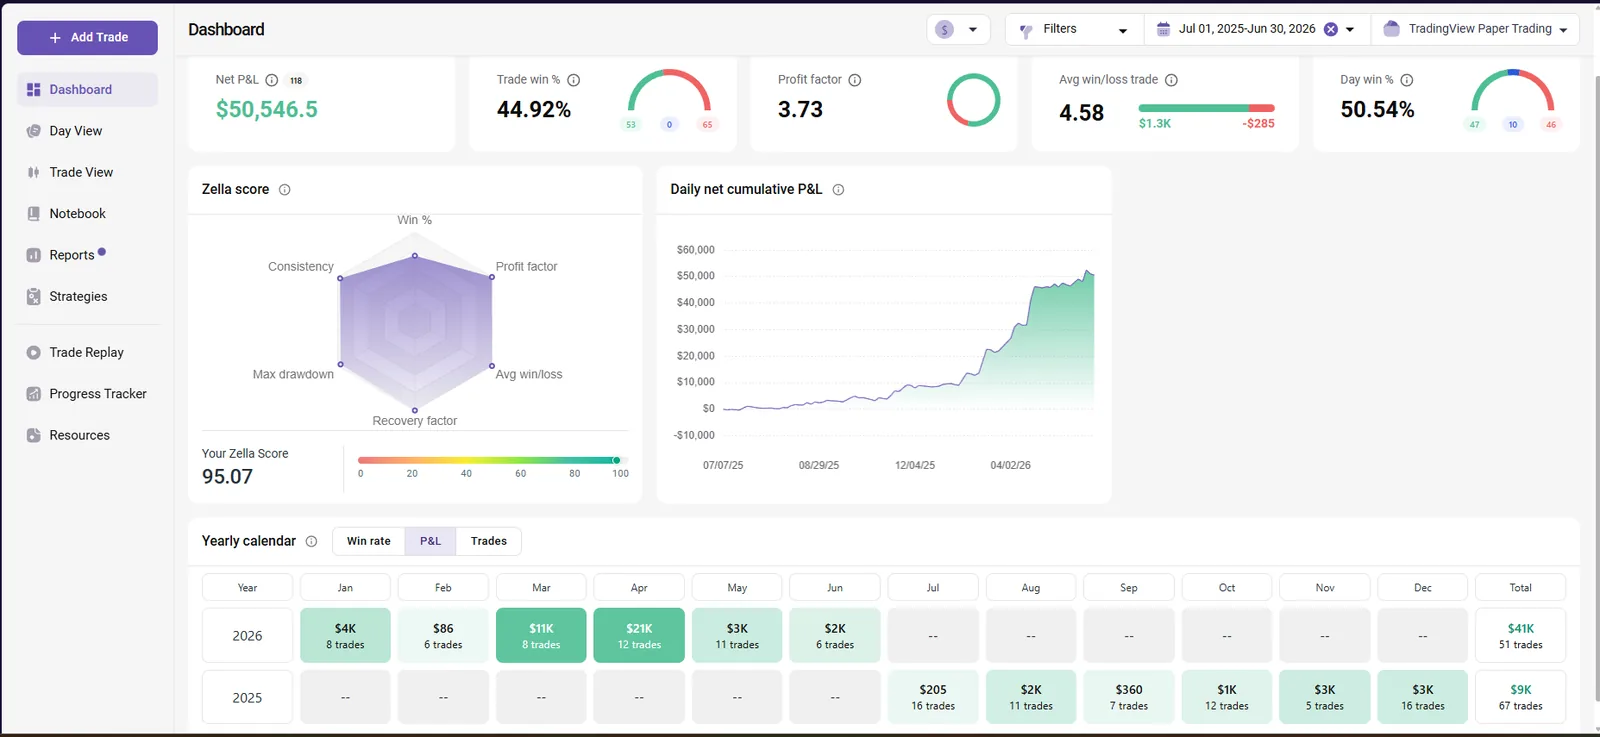
TradeZella merges partial exits into one position, so its trade count runs below the TradingView trade list; net P&L matches to the dollar.
Full metrics
Net / yr range · P25–P75 (1,500-path Monte Carlo)
| Percentile | Net / yr | Meaning |
|---|---|---|
| P25 | $16.1k | Weak year — bottom quartile of simulated paths |
| P50 | $20.1k | Median expectation |
| P75 | $24.1k | Strong year — top quartile |
Day-level performance
Risk-adjusted ratios · total Apr 2025 – Sep 2026
Modeled Apr 2025 – Mar 2026: Sharpe 2.44, PF 3.60, max DD $3,014 · Live Apr 2026 – Sep 2026: Sharpe 2.08, PF 2.85, max DD $4,100
How these numbers were calculated
Trade counts, win rates, profit factors and drawdown come directly from the TradingView Strategy Tester for the presets shown. Live-phase figures (Apr 2026 – Sep 2026) are real-account results at the same presets. Both reproduce 1:1.
DD%, vs-modeled ratios and percentile breakdowns are computed from the same trade list using standard methodology — reproducible in Excel or Python.
Time-to-payout, payout potential, Net $/yr ranges and blow rate come from a 1,500-path Monte Carlo over a 3-year horizon (input Apr 2025 – Sep 2026). Block bootstrap (5-day blocks) preserves streak autocorrelation.
Risk disclosure
150K-Precision’s Monte Carlo blow rate is 2.39% per year. Maximum drawdown over the total window (Apr 2025 – Sep 2026) was $4,100 — 91.1% of the hard DD budget. The lower-quartile (P25) outcome is $16.1k/yr. Trade-WR 40.0% ≈ 40 of 100 trades profitable. Day-WR 43%. Past performance, modeled or live, does not guarantee future results.
Other portfolios
All 15 configurations plus the PVE Index. Click any to view its detail page.
Get 150K-Precision + everything else.
The Ultimate tier includes all 10 strategies on all 4 instruments plus every published portfolio configuration — with sizing presets, TradingView invite access and monthly updates.
Get the closed trades by email, updated twice a week.
This month’s closed trades, newest first, grouped by day, with the total per portfolio — updated twice a week. Plus the Playbook.
By email, from Puerto Viejo, Costa Rica. Unsubscribe anytime.