Strategy ranking, risk before return: five climbed, none on one big month
Every quarter we rank all 32 strategy tracks with a score that puts risk before return. In the 2026-10 edition Anchor MNQ is #1 with $38.6k of net on a $2.1k max drawdown, seven tracks sit in Elite, five climbed and four moved down (source: PV_EDGE Master Data, ranking 2026-10, data to 2026-09-30).
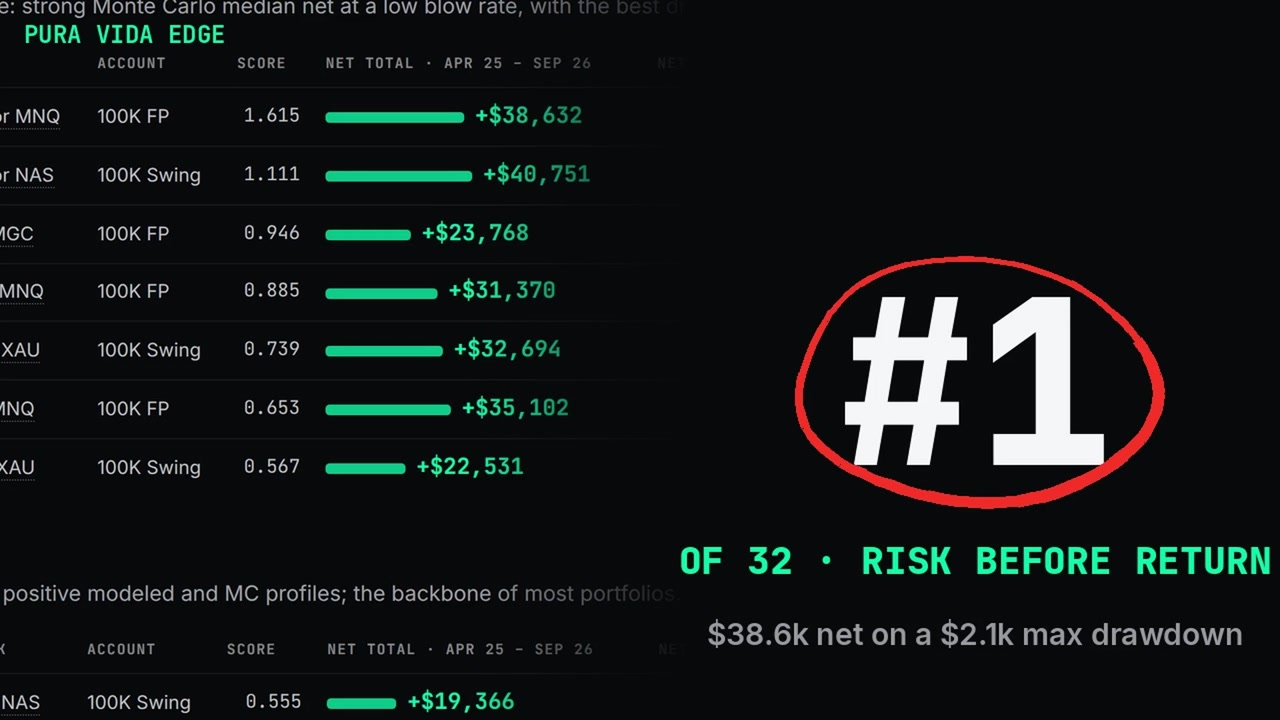
Video page with full transcript →
How is the score built?
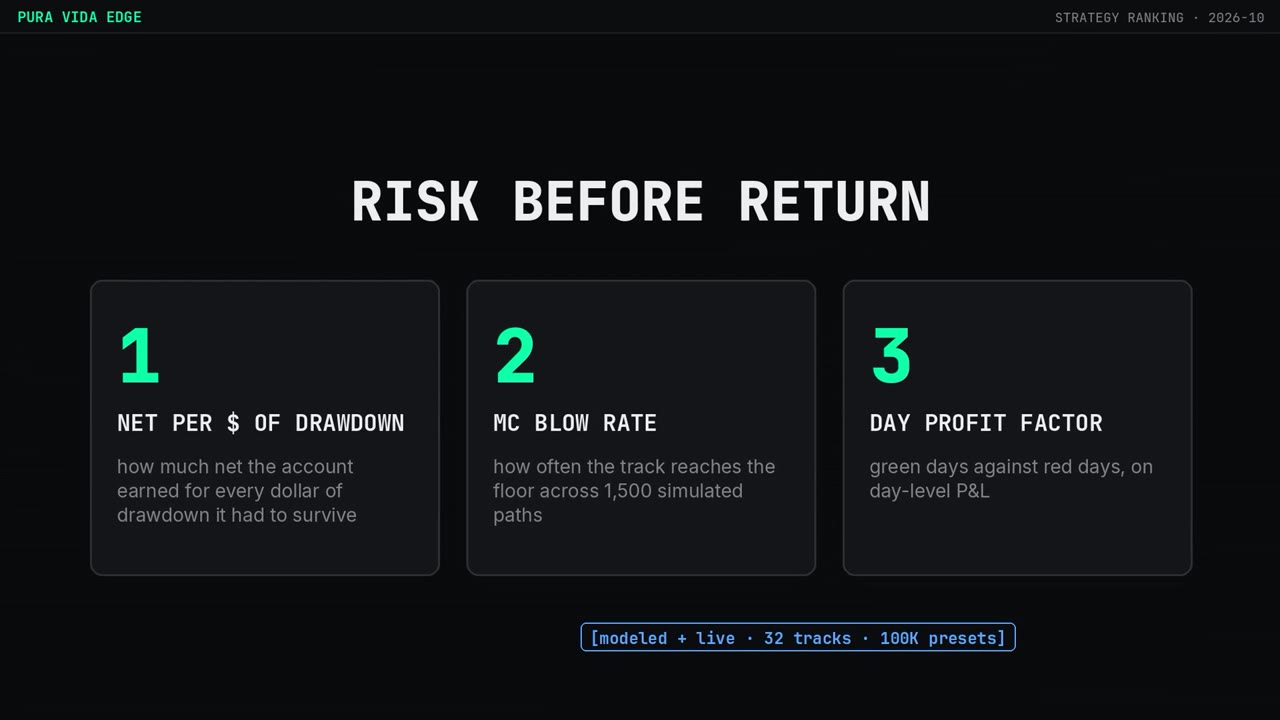
Three components in a fixed order: net per dollar of max drawdown, Monte Carlo blow rate (1,500 paths × 3 years), day profit factor. Net alone tells you who had a good quarter; net per dollar of drawdown tells you what the account had to survive to get it.
Who is in Elite?
| # | Track | Net, Apr 2025 – Sep 2026 | Blow / yr (MC) |
|---|---|---|---|
| 1 | Anchor MNQ | +$38,632 | 0.47% |
| 2 | Anchor NAS | +$40,751 | 0.00% |
| 3 | GAP MGC | +$23,768 | 2.04% |
| 4 | Open MNQ | +$31,370 | 2.39% |
| 5 | Trace XAU | +$32,694 | 0.02% |
| 6 | GAP MNQ | +$35,102 | 1.76% |
| 7 | Zone XAU | +$22,531 | 0.00% |
Four tracks earned more than Anchor MNQ. None survived on less drawdown.
Who climbed this quarter?
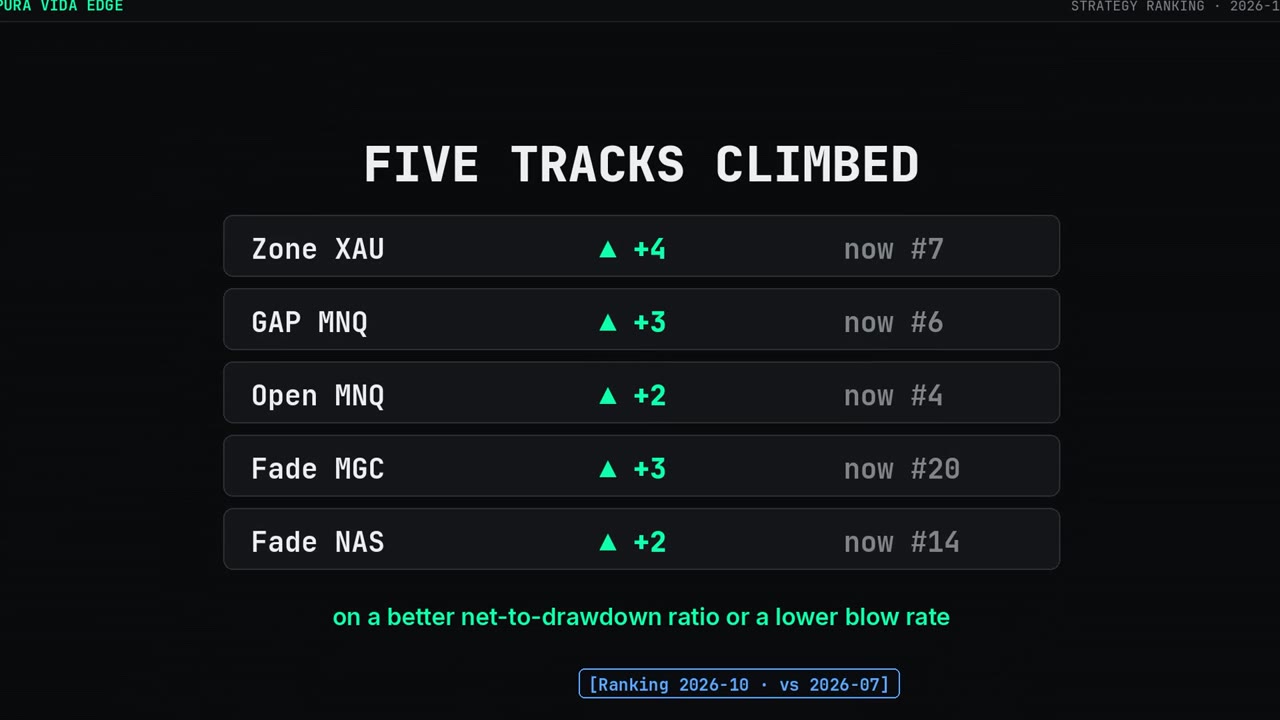
Zone XAU up four to seventh, GAP MNQ up three to sixth, Open MNQ up two to fourth, Fade NAS up two, Fade MGC up three. Every move on a better net-to-drawdown ratio or a lower blow rate, not on one big month. Drift XAU entered Core at #12 in its first quarter.
What does it mean when a track moves down?
Trace NAS, Open NAS, Reject MGC and Trace MGC moved down. The score punishes drawdown, not a red month, and all four stay in the catalog and in the PVE Index at their volatility weight. A drawdown that already happened is information; a red month on its own isn't.
What are the tiers for?
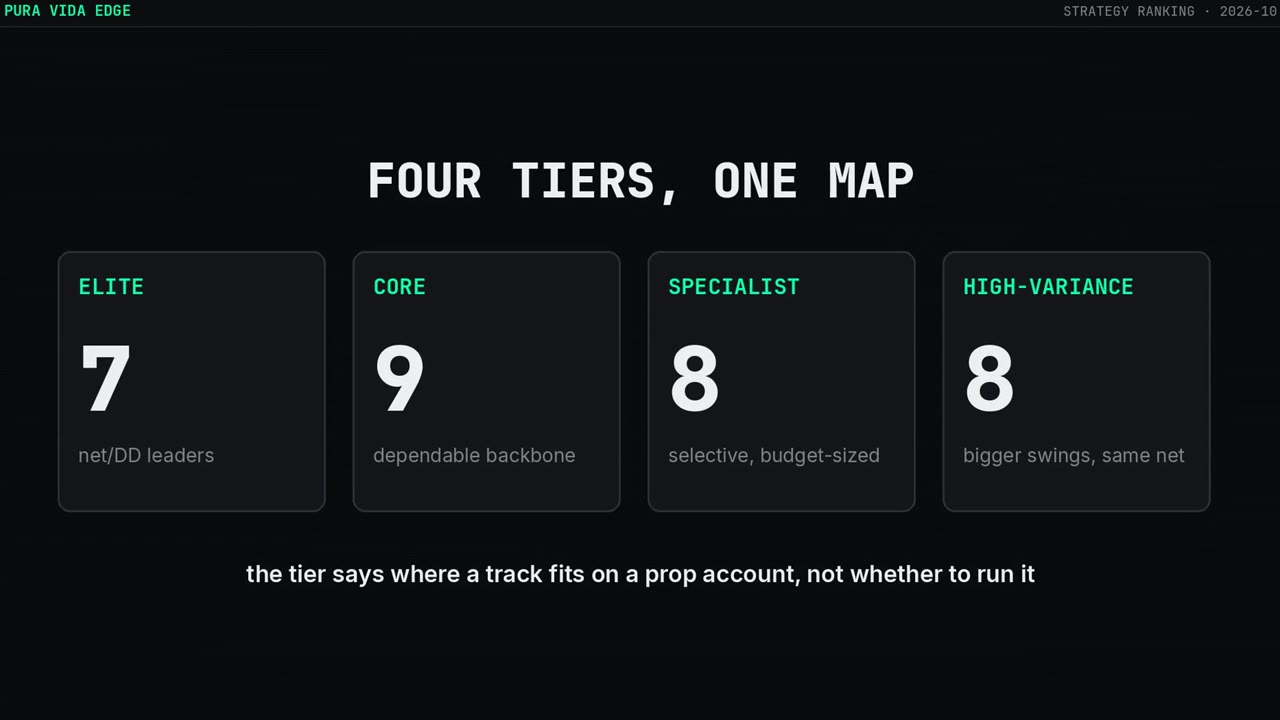
Elite 7, Core 9, Specialist 8, High-variance 8. The tier says where a track fits on a prop account, not whether to run it. The near-zero blow rates live in Elite and Core: Anchor NAS 0.00%, Trace XAU 0.02%, Zone XAU 0.00%. The full table is on the strategy ranking page.
The rule is the filter. The Playbook shows what fits through it.
Which configurations fit tight daily limits, trailing floors and consistency rules — sized to the drawdown, not the balance. One PDF, then our letters with what the systems did.
By email, from Puerto Viejo, Costa Rica. Unsubscribe anytime.
Related
FAQ
Is a rank a trade signal? No. The ranking is recalculated once a quarter. A move of four places means the ratio improved over the window, not that next quarter will.
Why isn't the biggest earner #1? Because the first component is net per dollar of drawdown. Anchor NAS earned more than Anchor MNQ but needed a $3.3k max drawdown to do it.
Does the Index use the ranking? The Index holds all 32 tracks weighted by volatility, independent of rank. The ranking is a map for choosing a tier for your own account.
Modeled and live layers are labeled separately. Monte Carlo figures (1,500 paths × 3 years) are a forecast. Hypothetical performance; past results do not guarantee future returns. Not financial advice.