Modeled: 2025-04-01 → 2026-03-31 · Live: 2026-04-01 → 2026-09-30 (real account, same presets)
GAP XAU 0.3 lot + Trace NAS 6 lot + Open NAS 12 lot + Hook NAS 6 lot — single 100K Forex Prop Swing account, one position per strategy.
About. Forex Prop Blend is the new NAS-heavy forex configuration anchored by Gap XAU — three Nasdaq strategies plus the weekly-gap component for diversification.
When to use. When you want NAS exposure with a gap-driven diversifier. Component strategies are live; the joint portfolio track started Q2’26.
At a glance
Modeled 12 months (Apr 2025 – Mar 2026) as sized; forecast metrics: Monte Carlo, 1,500 paths, 3-year horizon, input Apr 2025 – Sep 2026. Viability 3y = % of MC paths that never hit the hard drawdown. Payout potential : blow = full payout units reached in profit per one account blow over 3y (potential, not a payout schedule). TTP = median days to first payout unit.
Equity curve · modeled + live
Joint daily P&L applied to the $100,000 starting balance, log scale. Gray = modeled (2025-04-01 → 2026-03-31); accent = live (2026-04-01 → 2026-09-30), right of the “LIVE →” marker. Dotted red = hard DD floor ($90,000); dotted green = eval target ($110,000).
Quarterly breakdown
Q2’25–Q1’26 modeled · live since Q2’26 (real account, through Sep 2026). Portfolio as sized.
| Quarter | Layer | Net | WR | Trades | Max DD (EOD) |
|---|---|---|---|---|---|
| Q2'25 | modeled | +$9,155 | 42.4% | 33 | $4,303 |
| Q3'25 | modeled | +$2,003 | 50.0% | 24 | $3,031 |
| Q4'25 | modeled | +$23,969 | 63.3% | 30 | $1,261 |
| Q1'26 | modeled | +$26,140 | 72.7% | 33 | $2,687 |
| Q2'26 live | live | +$15,501 | 68.8% | 16 | $2,577 |
| Q3'26 live | live | +$6,957 | 44.1% | 34 | $4,054 |
What's running
| Strategy | Qty | Role |
|---|---|---|
| GAP XAU | 0.3 lot | portfolio-only |
| Trace NAS | 6 lot | standalone |
| Open NAS | 12 lot | standalone |
| Hook NAS | 6 lot | standalone |
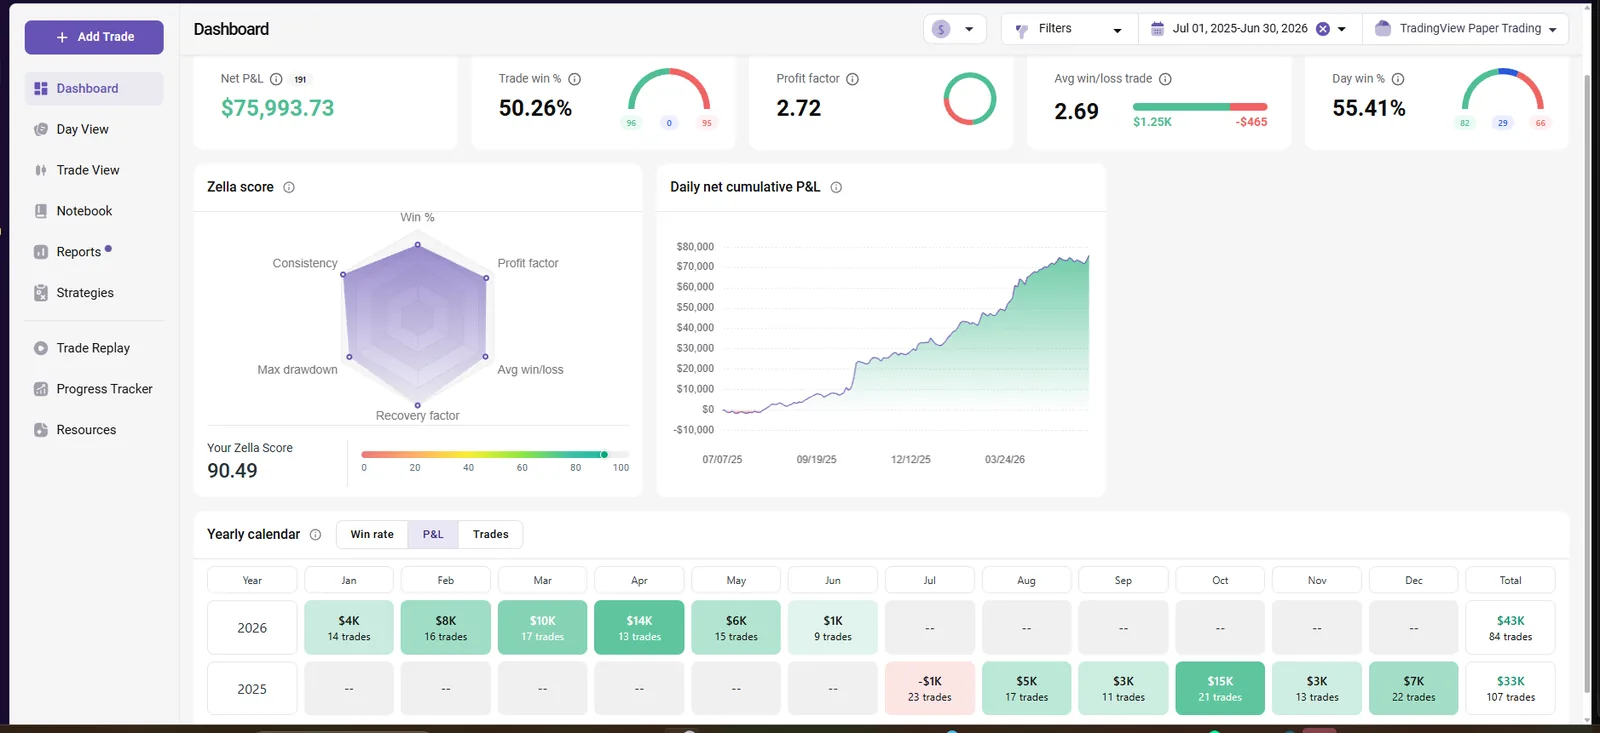
TradeZella merges partial exits into one position, so its trade count runs below the TradingView trade list; net P&L matches to the dollar.
Full metrics
Net / yr range · P25–P75 (1,500-path Monte Carlo)
| Percentile | Net / yr | Meaning |
|---|---|---|
| P25 | $33.4k | Weak year — bottom quartile of simulated paths |
| P50 | $38.6k | Median expectation |
| P75 | $43.7k | Strong year — top quartile |
Day-level performance
Risk-adjusted ratios · modeled 12M
How these numbers were calculated
Trade counts, win rates, profit factors and drawdown come directly from the TradingView Strategy Tester for the presets shown. Live-phase figures (Apr 2026 – Sep 2026) are real-account results at the same presets. Both reproduce 1:1.
DD%, vs-modeled ratios and percentile breakdowns are computed from the same trade list using standard methodology — reproducible in Excel or Python.
Time-to-payout, payout potential, Net $/yr ranges and blow rate come from a 1,500-path Monte Carlo over a 3-year horizon (input Apr 2025 – Sep 2026). Block bootstrap (5-day blocks) preserves streak autocorrelation.
Risk disclosure
Forex Prop Blend’s modeled blow rate is 0.18% per year. Maximum drawdown on the modeled period (Apr 2025 – Mar 2026) was $7,334 — 73.3% of the hard DD budget; live max DD (Apr 2026 – Sep 2026) $4,054. The lower-quartile (P25) outcome is $33.4k/yr. Trade-WR 57.5% ≈ 58 of 100 trades profitable. Day-WR 61%. Past performance, modeled or live, does not guarantee future results.
Other portfolios
All 15 configurations plus the PVE Index. Click any to view its detail page.
Get Forex Prop Blend + everything else.
The Ultimate tier includes all 10 strategies on all 4 instruments plus every published portfolio configuration — with sizing presets, TradingView invite access and monthly updates.