Prop firm rules on your TradingView chart: daily limit and drawdown floor
Prop firm accounts end on two numbers: the daily loss limit and the drawdown floor. The Prop Firm Rules Overlay indicator draws both on your TradingView chart as prices, for a long and a short entry at the same time, and adds a consistency-rule counter. You enter your account figures once; the lines show where a trade would breach each rule.
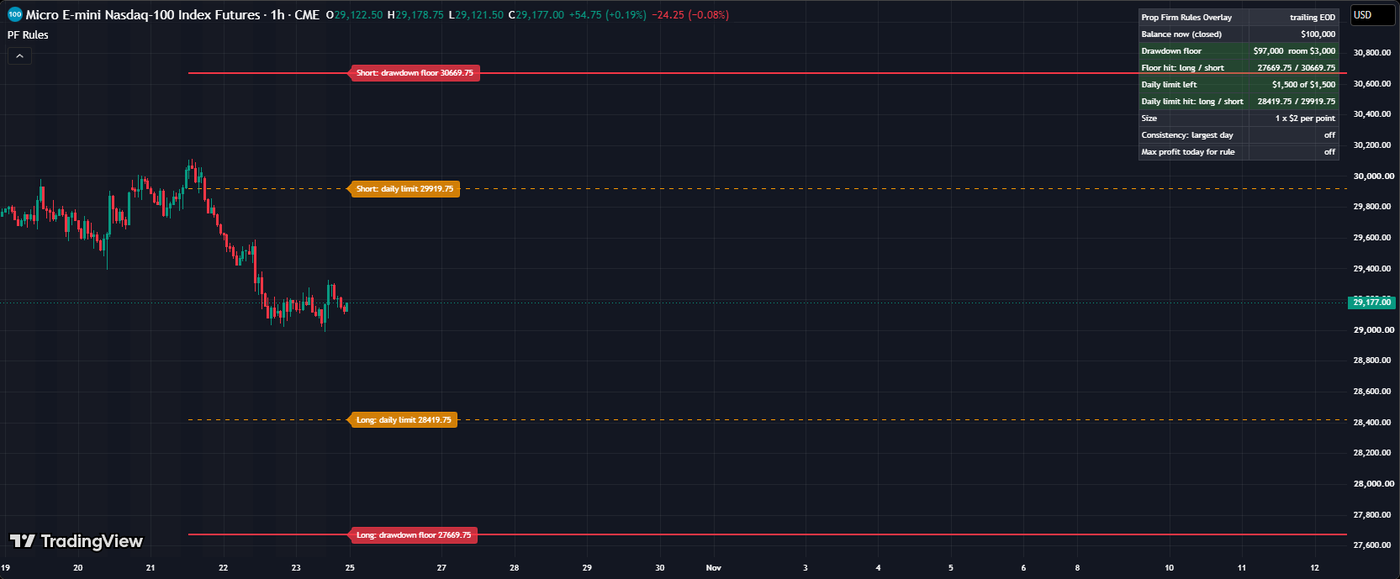
What the indicator shows
- Drawdown floor. The floor in USD, the room above it, and the price at which the open position would reach it, for a long and a short entry.
- Daily loss limit. The room left for today, based on realized P&L, and the price at which the position would use it up.
- Consistency rule. The largest single day as a share of total profit, and the maximum profit today that keeps the rule intact.
The status table colors each line: green when there is room, yellow below 25 percent of the limit, red when a limit is reached.
Trailing end-of-day vs static drawdown
With an end-of-day trailing drawdown the floor follows the highest end-of-day balance and locks once it reaches the starting balance. With a static drawdown the floor is fixed below the starting balance and never moves. Pick the model your account uses in the inputs; the indicator draws the floor accordingly.
How to set it up
- Add the indicator to your chart: Indicators → search “Prop Firm Rules Overlay”.
- Click the last bar of the chart to set the entry price. For a position already open, change the entry price to your fill price.
- Fill in your account in the Inputs window: starting balance, max drawdown, daily loss limit, the balance at the last end of day, the highest end-of-day balance (trailing model), realized P&L today and position size.
- On a CFD or forex symbol, enter the USD value of a 1-point move for 1 lot in “Value of 1 point for 1 unit”. On futures the point value comes from the symbol.
- Update the account inputs once a day, before the session.
Reading the long and short lines
Example: MNQ, 1 contract, a daily loss limit of $1,000. MNQ moves $2 per point per contract, so the limit equals $1,000 ÷ $2 = 500 points. The long line sits 500 points below your entry price, the short line 500 points above it. If price reaches the line on your side, the position has used up today’s limit. The drawdown floor lines work the same way with the room above the floor instead of the daily limit.
What it does not do
- It does not read your account. It is a calculator drawn on the chart, and its figures are only as current as the inputs.
- It covers two drawdown models, end-of-day trailing and static. Intraday trailing is not modeled.
- No alerts, no orders, no external data.
For the consistency rule math in more detail, use the consistency rule calculator. All our calculators are on the tools page.
FAQ
Does it connect to my prop firm account?
No. TradingView cannot read your account, so you enter the figures by hand in the Inputs window: starting balance, max drawdown, daily loss limit, the balance at the last end of day, the highest end-of-day balance, realized P&L today and position size. The lines are only as current as those inputs.
Which drawdown models does it support?
Two: end-of-day trailing, where the floor follows the highest end-of-day balance and locks once it reaches the starting balance, and static, where the floor is fixed below the starting balance. Intraday trailing is not modeled.
Does it work for CFD and forex?
Yes. On futures the point value comes from the symbol. On a CFD or forex symbol you enter the USD value of a 1-point move for 1 lot in the "Value of 1 point for 1 unit" input.