Thirty-two strategies behind one ticker
The PVE Index (Forex, Futures) reads like a stock ticker: the Forex version at 267.81, the Futures version at 176.38, both from 100 on April 1, 2025. Source: PV_EDGE_Master_Data, refreshed 2026-10-02. Behind each number is a full set of systematic strategies on one prop firm account. This article shows how the number is built, what it means for payouts, and what sits underneath.
Watch page with full transcript →
How is the ticker built?
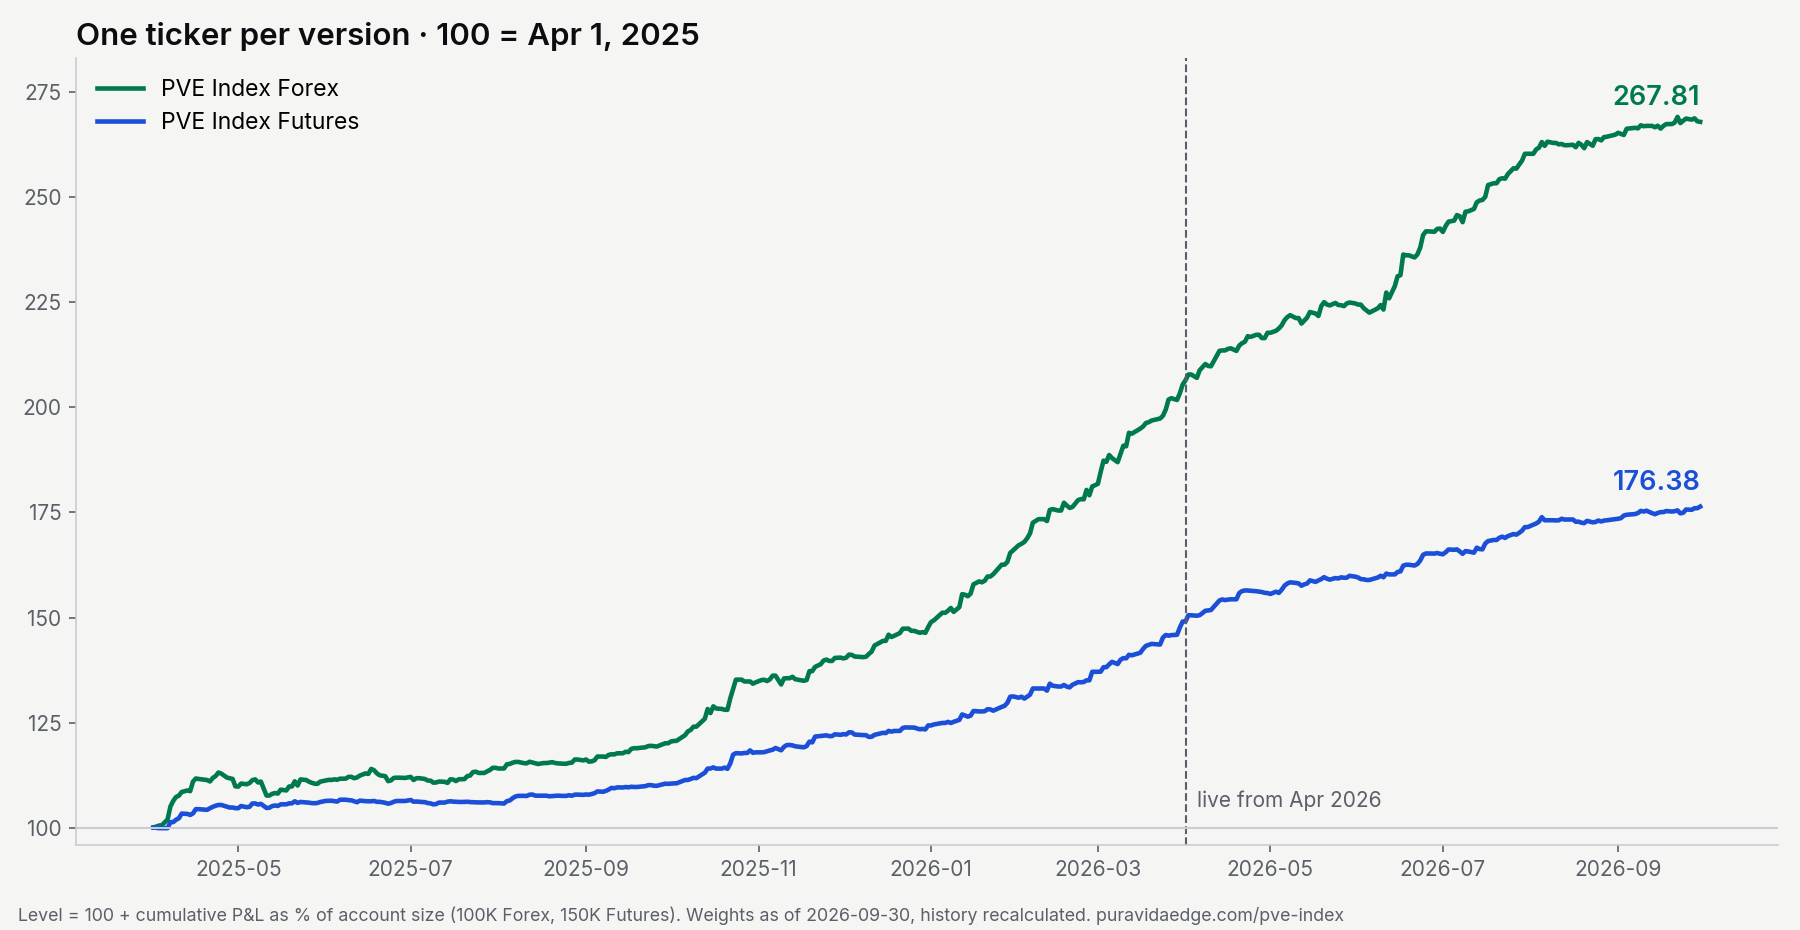
Level = 100 + cumulative profit as a percent of account size.
| Version | Account | Cumulative profit | Level |
|---|---|---|---|
| Index Forex | 100K Swing | +$167,814 | 267.81 |
| Index Futures | 150K | +$114,576 | 176.38 |
Percent of account size, not of the running balance, so a gain later in the year is not inflated by earlier ones. One point is 1% of account size: $1,000 on Forex, $1,500 on Futures. The two versions are never added together.
What does the ticker mean for prop firm payouts?
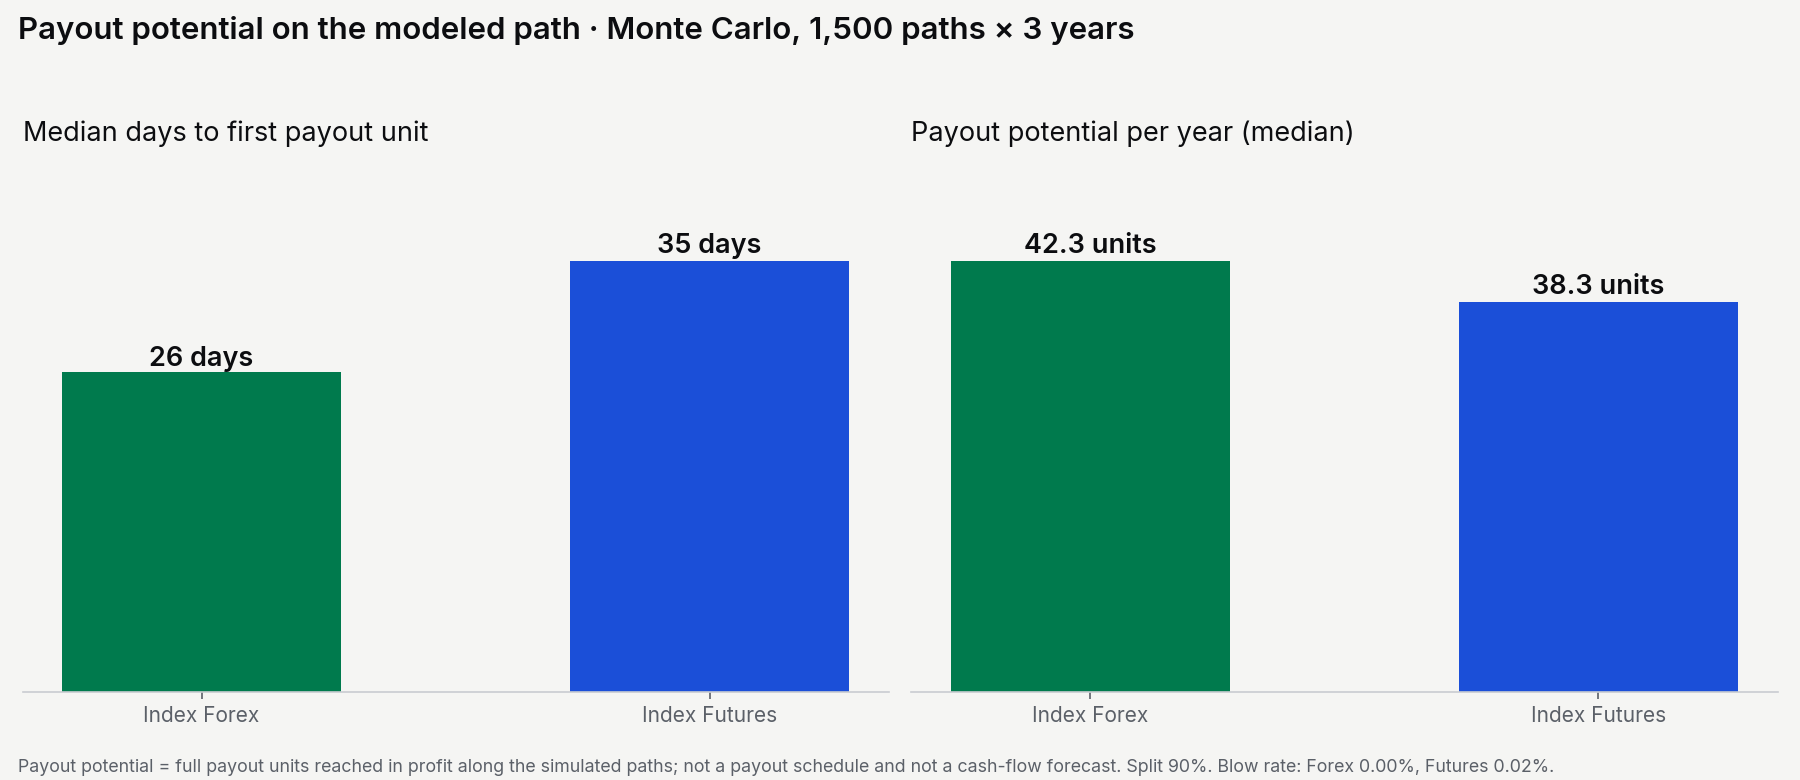
| Version | Median days to first payout unit | Payout potential / yr | Blow rate / yr |
|---|---|---|---|
| Index Forex (100K) | 26 | 42.3 units | 0.00% |
| Index Futures (150K) | 35 | 38.3 units | 0.02% |
Monte Carlo, 1,500 paths × 3 years, input April 2025 – September 2026, 90% split. Payout potential counts the full payout units a simulated account reaches in profit. It is not a payout schedule; when you can withdraw is set by your account's rules. It answers one question: how much room does the profit leave for payouts before resets eat it? You can run your own strategy through the same test in the Monte Carlo simulator, and see attempts and real cost in the pass estimator.
What sits underneath the ticker?
Sixteen strategy tracks on the Forex version, fifteen on the Futures version. Each is sized by its own volatility and capped at the risk budget it would carry alone; the sizing lives in the script. The largest single share of risk is 9.6% on Forex and 17.3% on Futures, because a futures track cannot trade less than one whole contract. No single strategy carries more than a fifth of the risk in either version.
What moved the ticker in September?
On the Forex version, 9 of 16 tracks finished September green; on the Futures version, 11 of 15. Twenty systems moved the ticker up, and both versions closed the month up: +3.04% of account size on Forex, +2.97% on Futures. No single one could have done it alone, and none of them needed anyone at the screen.
How does the rebalance work?
Every quarter, and whenever a new strategy joins, the weights are recalculated from volatility, never from last quarter's results. On 2026-09-30 the Drift family joined and the history was recalculated with the new weights from April 2025. The ticker you see today is not the ticker from an older screenshot, and it will not be the ticker after the next rebalance: one curve describes one product, and every change is dated.
What the ticker does not say
The payout numbers are modeled. The live layer, April to September 2026, is published separately: Forex +$62,413, Futures +$40,964 on a six-month window, which is an observation and not an annual claim. The simulation can only remix what the data has already seen.
The live ticker, the composition with every track and risk share, and the payout potential for both versions are on the PVE Index page. For a smaller set on one account, see the portfolios; for the base rate across traders, see what percentage of traders pass prop firm challenges.
FAQ
Is 42 payouts a year a promise? No. It is the median payout potential on simulated paths: units that fit inside modeled profit. Real withdrawals follow your account's rules and timing.
Why does the Futures version read lower? It runs on a 150K account, in whole contracts, under a trailing end-of-day drawdown. Both versions are shown separately and never added together.
Why are the futures risk shares uneven? A futures track cannot trade less than one whole contract. The cap still applies, but the steps are coarser than on forex lots.
Hypothetical performance. Modeled results (April 2025 – March 2026) and live results (April – September 2026) are separate layers. Past results do not guarantee future returns. Not financial advice.