The Index: six quarters without a red one
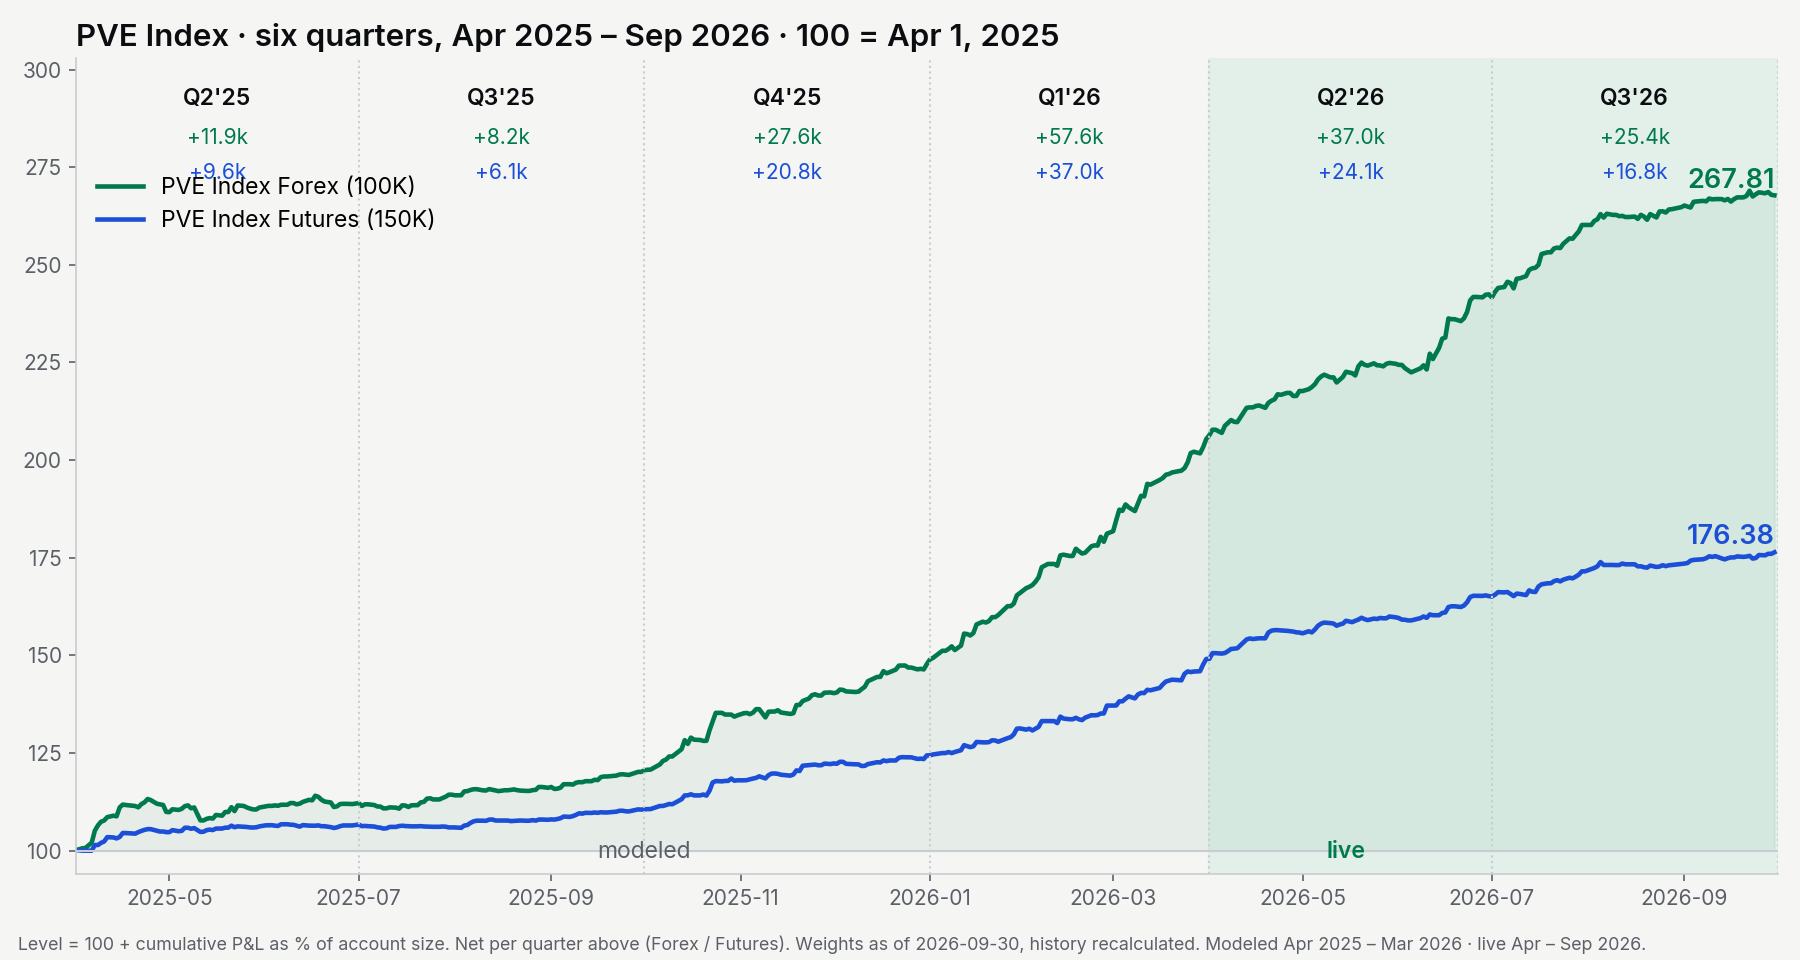
Six quarters, April 2025 to September 2026, and not one of them red in either version of the PVE Index (Forex, Futures). Four quarters are modeled, two are live. Source: PV_EDGE_Master_Data, refreshed 2026-10-02. A green quarter is the headline; whether it pays depends on three other numbers, and they are below.
Watch page with full transcript →
What is the PVE Index?
A full set of systematic strategies run on one prop firm account, in two versions: Forex (100K Swing) and Futures (150K). Every strategy is sized by its own volatility and capped at the risk budget it would carry alone, so no single one decides a day. The weights are recalculated every quarter and whenever a new strategy joins, from volatility and never from last quarter's results. The sizing lives in the script, not in anyone's discipline. The current weights are dated 2026-09-30; the history below is recalculated with them from April 2025.
Were all six quarters really green?
| Quarter | Layer | Index Forex (100K) | Index Futures (150K) |
|---|---|---|---|
| Q2 2025 | modeled | +$11,903 | +$9,637 |
| Q3 2025 | modeled | +$8,236 | +$6,096 |
| Q4 2025 | modeled | +$27,623 | +$20,837 |
| Q1 2026 | modeled | +$57,638 | +$37,041 |
| Q2 2026 | live | +$37,050 | +$24,144 |
| Q3 2026 | live | +$25,363 | +$16,820 |
Total since April 2025: Index Forex +$167,814 on 100K, Index Futures +$114,576 on 150K. The two versions are never added together. Q3 2026 added 25.4% of the account on Forex and 11.2% on Futures, three times the same quarter a year earlier on Forex and 2.8 times on Futures, with the same limits.
Does a green quarter mean the account got paid?
No. On a prop firm account, staying inside the limit pays; the quarter only describes the shape. Three numbers decide it:
- Worst day against the limit. How much of the daily loss limit or trailing drawdown one day used.
- Blow rate. How often the account reaches the floor in simulation.
- Payout potential. How many payout units the profit leaves room for, and how fast the first one arrives.
The rest of this article is those three numbers for the Index.
How close did the worst day get to the limit?
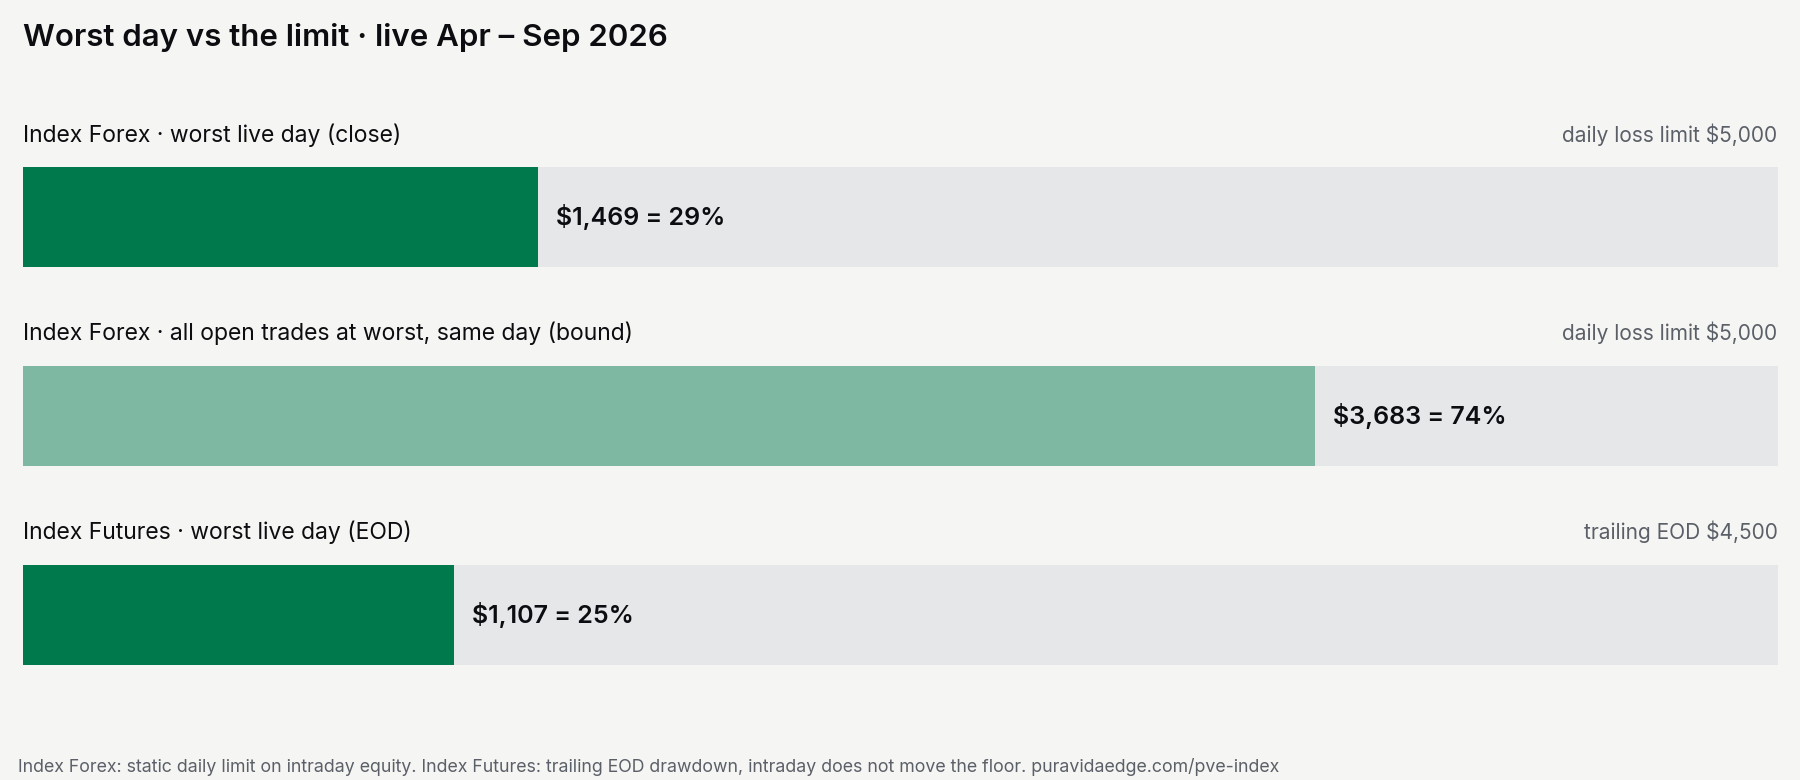
From the live layer, April to September 2026:
- Index Forex: the worst live day cost $1,469 against a $5,000 daily loss limit, 29% of the limit. A typical trade dips $179 before it resolves. With every open trade at its worst point on the same day, the total would be $3,683, an upper bound that still stays under the limit.
- Index Futures: the floor trails end of day, so only closes count. The worst live day closed at $1,107 against a $4,500 trailing drawdown, 25%.
How each rule type works is in the prop firm daily loss limit explained and trailing vs static vs daily loss drawdown guides.
What is the blow rate?
Six live months cannot show the tail, so the Index runs a Monte Carlo forecast: 1,500 paths, three years each, built from April 2025 to September 2026, with a 90% split.
| Version | Blow rate / yr | Viability 3y |
|---|---|---|
| Index Forex (100K) | 0.00% | 100% |
| Index Futures (150K) | 0.02% | 99.9% |
A forecast, not a record. The simulation can only remix what the data has already seen; a market it has not seen is not in there. The same test on your own numbers runs in the Monte Carlo simulator.
How many payouts does that leave room for?
On the same paths, the Forex version reaches its first payout unit in a median of 26 days and fits a payout potential of 42 units a year. The Futures version: 35 days and 38 units. Payout potential counts full payout units reached in profit; it is not a payout schedule, and when you can withdraw is set by your account's rules. The chain is the point: stay inside the limit, keep the blow rate near zero, and the payouts follow.
Is live running at the modeled pace?
Six months live: Index Forex +$62,413, Index Futures +$40,964. On the Forex version that is 118% of the modeled pace. That is an observation on a six-month window, not a basis for annual claims. The live ticker, every quarter and the full composition of both versions are on the PVE Index page. Smaller sets on one account start from two strategies in the portfolios.
FAQ
Are the six quarters live results? Four are modeled (April 2025 – March 2026) and two are live (April – September 2026). The layers are separated on every chart and table.
Why does the Futures version read lower? It runs on a 150K account, in whole contracts, under a trailing end-of-day drawdown of $4,500. It is a different account, shown separately.
Why was the history recalculated? On 2026-09-30 the Drift family joined and the weights were recalculated from volatility. The whole history is recalculated with the new weights so that one curve describes one product.
Does 0.00% blown mean the account cannot fail? No. None of 1,500 simulated three-year paths reached the floor. A market the simulation has not seen is not in there.
Hypothetical performance. Modeled results (April 2025 – March 2026) and live results (April – September 2026) are separate layers, at 100K Swing (Forex) and 150K (Futures) presets. Past results do not guarantee future returns. Not financial advice.