Fewer Strategies, More Per Dollar of Drawdown
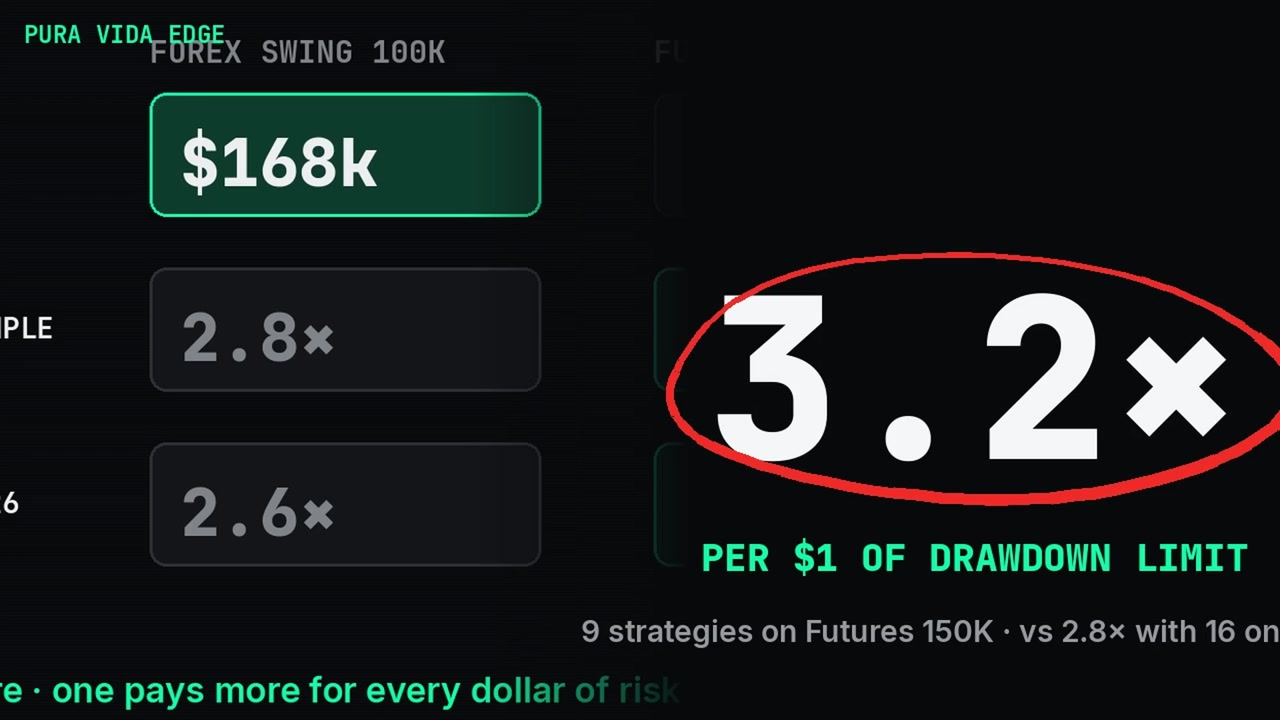
Nine strategies on a Futures 150K account earned 3.2× per dollar of drawdown limit in-sample and 3.6× in Q3 2026; sixteen on a Forex Swing 100K earned 2.8× and 2.6×. In dollars, Forex won: $168k against $87k in-sample (source: PV_EDGE Master Data, DATA 2026-10-10, catalog only).
Transcript
Nine strategies on a Futures 150K account earned more per dollar of drawdown limit than sixteen on a Forex Swing 100K. Three point two times, against two point eight. Same thirty-two strategies. Two accounts. The account's rules decide how many fit.
First rule: the floor. A static floor never moves. A trailing floor follows your peak, until the buffer locks. Every strategy is sized to that floor, so the trailing account fits less. Second rule: no hedging.
Two strategies can't hold opposite positions on one instrument. One of them has to go. That's why nine, not sixteen. Then the result. In dollars, Forex wins: one hundred sixty-eight thousand against eighty-seven, in-sample. Per dollar of drawdown limit, Futures wins:
three point two against two point eight in-sample, three point six against two point six in the third quarter. Both accounts win on something. One pays more. One pays more for every dollar of risk you're allowed.
On a prop account, both versions of the Index tell the same story. Forex: worst live day fourteen sixty-nine against a five-thousand daily limit, blow rate zero, forty-two payout units a year. Futures: worst live day eleven hundred against a forty-five hundred trailing floor, blow rate zero point zero two, thirty-eight units a year.
Read the account rules before you pick the basket. The Index comes in both versions: Forex and Futures. Both are on the Index page.
10 strategies, 15 portfolios, one PDF.
Every result on this site, modeled and live separately, with the preset for each account tier. One PDF, then our letters with what the systems did.
By email, from Puerto Viejo, Costa Rica. Unsubscribe anytime.
Read the full write-up
- Fewer Strategies, More Per Dollar of Drawdown: Two Prop Accounts
- The No-Hedging Rule: Why Nine Strategies Fit Where Sixteen Would
All videos → · Watch on YouTube →
All figures are hypothetical or from live-tracked accounts as stated in the video. Past and simulated performance does not guarantee future results. This is educational content, not financial advice.