We Picked the Top 10% Strategies. Holding All of Them Won.
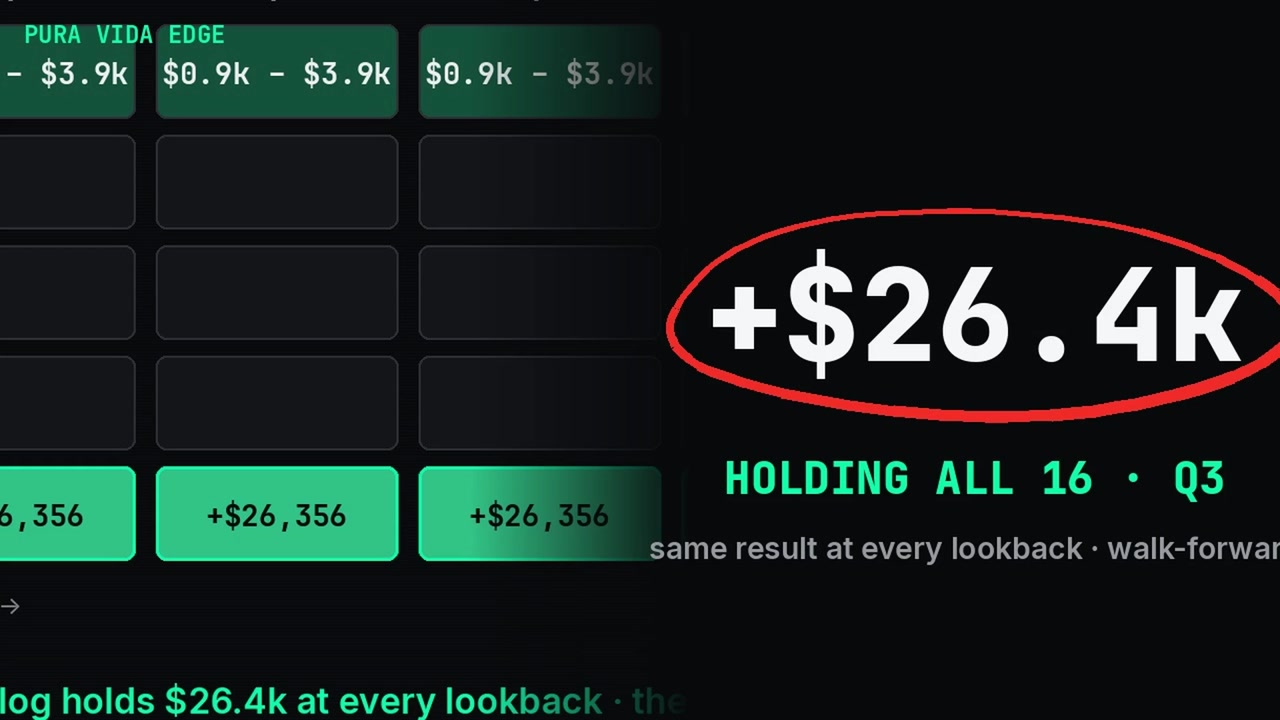
Chosen on June 30 and measured in Q3 2026, holding all 16 strategies on a Forex Swing 100K account returned +$26,356 at every lookback from one to five quarters, while the top-10% shortlist returned between $900 and $3,900 depending on which lookback picked it (source: PV_EDGE Master Data, DATA 2026-10-10, catalog only).
Transcript
Hold every strategy, and the third quarter reads plus twenty-six thousand, three hundred fifty-six on a Forex Swing 100K account. The same number, whichever lookback you pick. We ran a test. Rank the strategies on the last one, two, three, four or five quarters.
Keep the top ten percent, or a quarter, or half, or all of them. Then see what each basket did. First, the version everyone does without noticing: pick the best, knowing the result. Selected with hindsight.
The top ten percent always looks brilliant. That's the trap. Now the real test. Choose on June 30. Measure July to September. The whole catalog holds twenty-six thousand four hundred. The shortlist fades to somewhere between nine hundred and three thousand nine hundred.
And the whole catalog gives the same answer at every lookback. One quarter, five quarters, no difference. The shortlist gives a different answer every time. What holding everything means on a prop account: it's the Index Forex version.
Worst live day: fourteen sixty-nine against a five-thousand daily limit, twenty-nine percent. Max drawdown, live: two thousand five hundred, a quarter of the ten-thousand hard limit. Blow rate: zero in fifteen hundred simulated paths. Payout potential:
forty-two units a year. That's why the Index holds every strategy. And why the weights come from volatility, never from last quarter's results. The Index page has every track.
10 strategies, 15 portfolios, one PDF.
Every result on this site, modeled and live separately, with the preset for each account tier. One PDF, then our letters with what the systems did.
By email, from Puerto Viejo, Costa Rica. Unsubscribe anytime.
Read the full write-up
- We Picked the Top 10% Strategies. Holding All of Them Won.
- Selected With Hindsight: The Trap in Most Strategy Track Records
All videos → · Watch on YouTube →
All figures are hypothetical or from live-tracked accounts as stated in the video. Past and simulated performance does not guarantee future results. This is educational content, not financial advice.