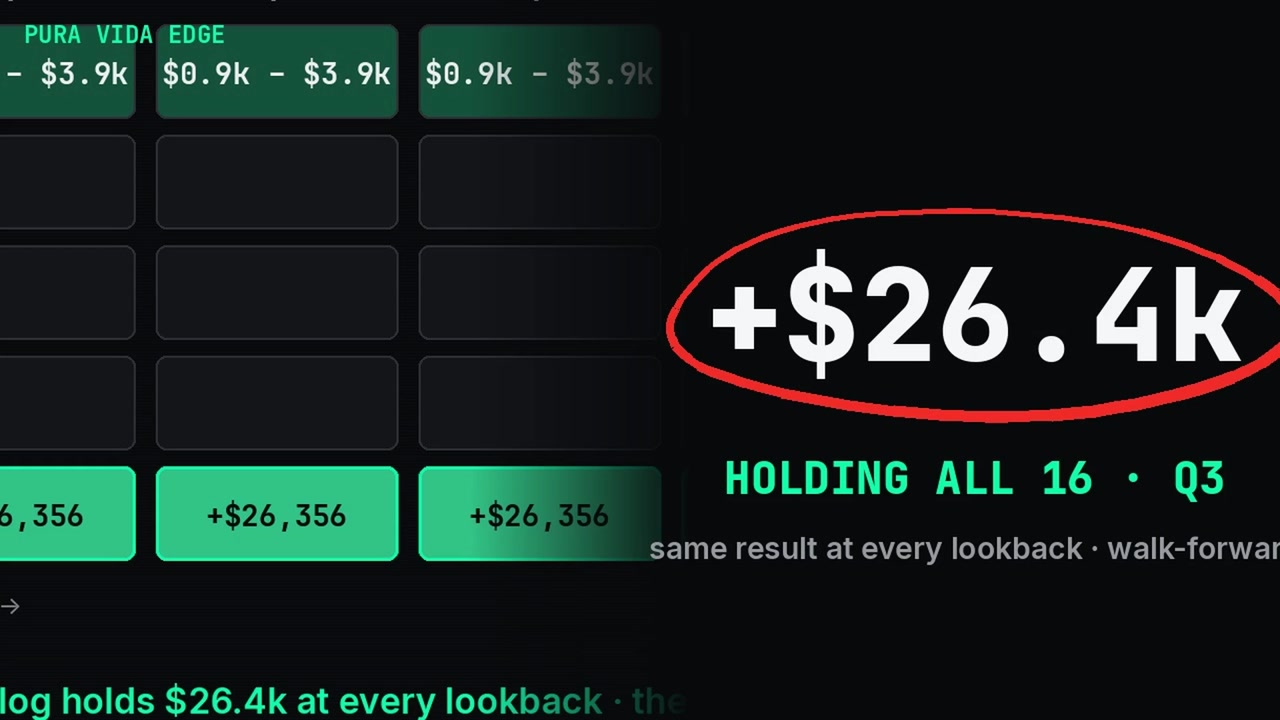
We picked the top 10% strategies. Holding all of them won.
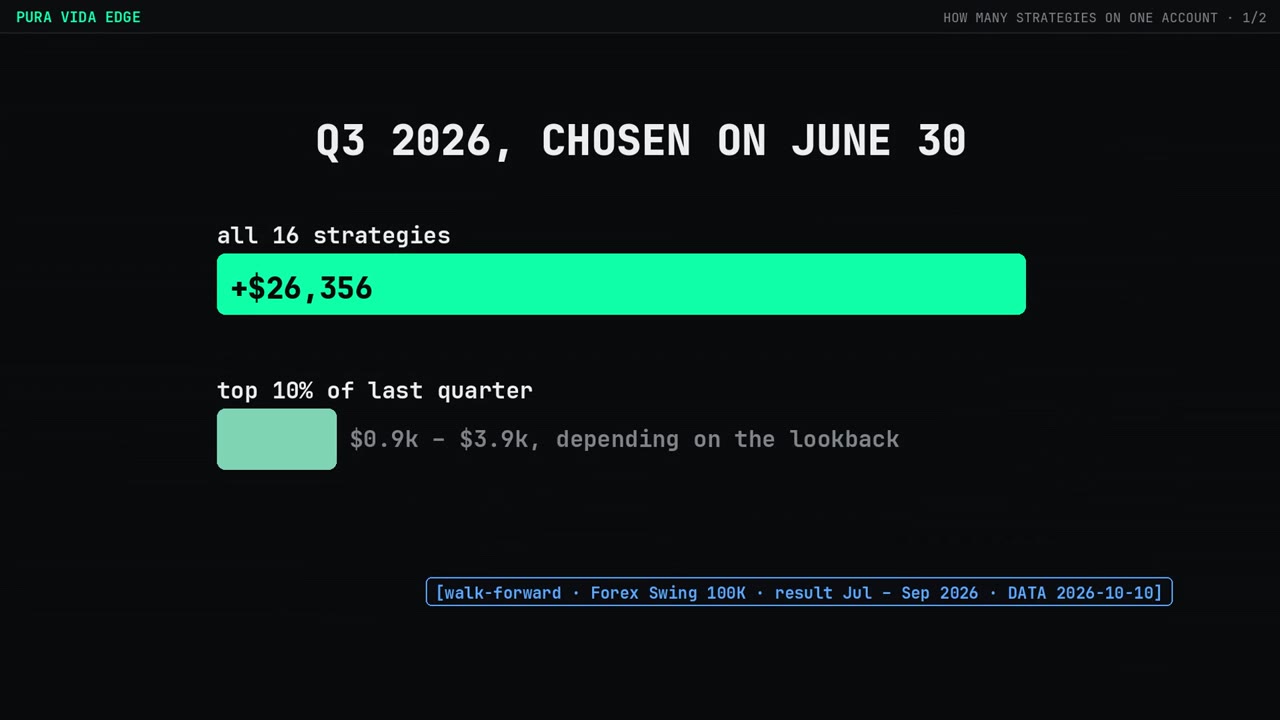
Chosen on June 30 and measured in Q3 2026, holding all 16 strategies on a Forex Swing 100K account returned +$26,356 at every lookback from one to five quarters, while the top-10% shortlist returned between $900 and $3,900 depending on which lookback picked it (source: PV_EDGE Master Data, DATA 2026-10-10, catalog only).
Video page with full transcript →
What was the test?
Rank the strategies on the last one, two, three, four or five quarters. Keep the top 10%, 25%, 50%, 75% or all 16. Then measure what each basket did in the next quarter. Selection and sizing used data to June 30, 2026; results are July to September. Sizing follows the Index method.
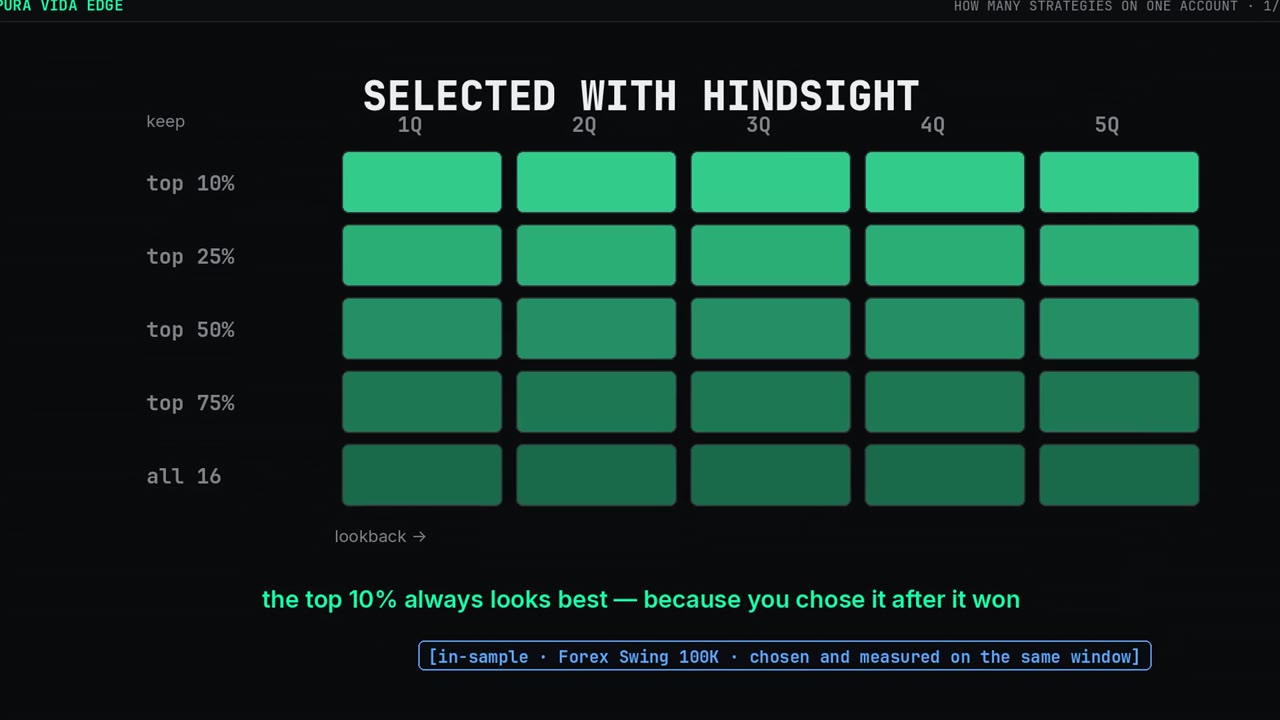
What does "selected with hindsight" look like?
Pick the best knowing the result. Chosen and measured on the same window, the top 10% always looks brilliant, because you chose the winners after they won. It's the version everybody does without noticing.
What happened walk-forward?
| Basket, chosen June 30 | Q3 2026 result |
|---|---|
| All 16 strategies | +$26,356 at every lookback |
| Top 10% of last quarter | $0.9k – $3.9k, depending on the lookback |
The whole catalog gave the same answer whichever lookback it was ranked on. The shortlist gave a different answer every time.
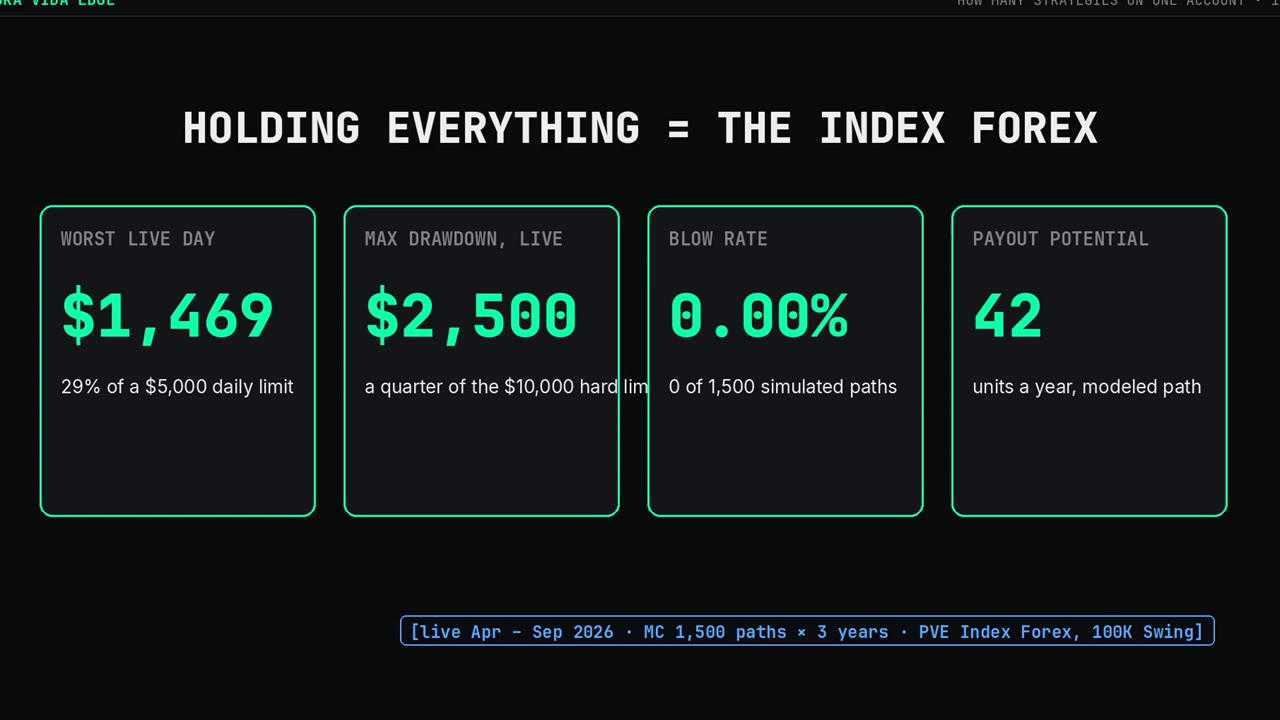
What does holding everything mean on a prop account?
Holding all 16 on a 100K swing account is the PVE Index Forex version: worst live day $1,469 against a $5,000 daily limit (29%), max live drawdown $2,500 against a $10,000 hard limit, zero blown paths in 1,500, 42 payout units a year on the modeled path.
Why does the Index weight by volatility and not by last quarter?
Because the alternative is exactly the shortlist above: picking by last quarter's result and expecting it to hold. Each track's weight comes from how much it moves, capped at what it would carry alone, recalculated every quarter. Never from who won last time.
Passing is sizing. The Playbook has the sizes.
Every portfolio configuration with the drawdown it is sized for, so the rules you just read map to a preset. One PDF, then our letters with what the systems did.
By email, from Puerto Viejo, Costa Rica. Unsubscribe anytime.
Related
FAQ
What metric picked the top 10%? Net divided by the larger of the window's max drawdown and one unit of risk. The one-unit floor keeps a quiet lucky quarter from scoring infinite on a tiny net.
Why only one out-of-sample quarter? Because only one exists after the live launch window. It's enough to show the shape of the trap, not to size it.
Does this apply to futures accounts too? The futures baskets change with the no-hedging rule; that comparison is in Fewer strategies, more per dollar of drawdown.
Modeled and live layers are labeled separately. Monte Carlo figures (1,500 paths × 3 years) are a forecast. Hypothetical performance; past results do not guarantee future returns. Not financial advice.