Seven months live: what the Index did on real prop accounts, month by month
The PVE Index (Forex, Futures) went live on 1 April 2026. Seven closed months later this is the live record, month by month, with the modeled year it followed kept on a separate line. Both versions, both accounts, every month.
The seven months
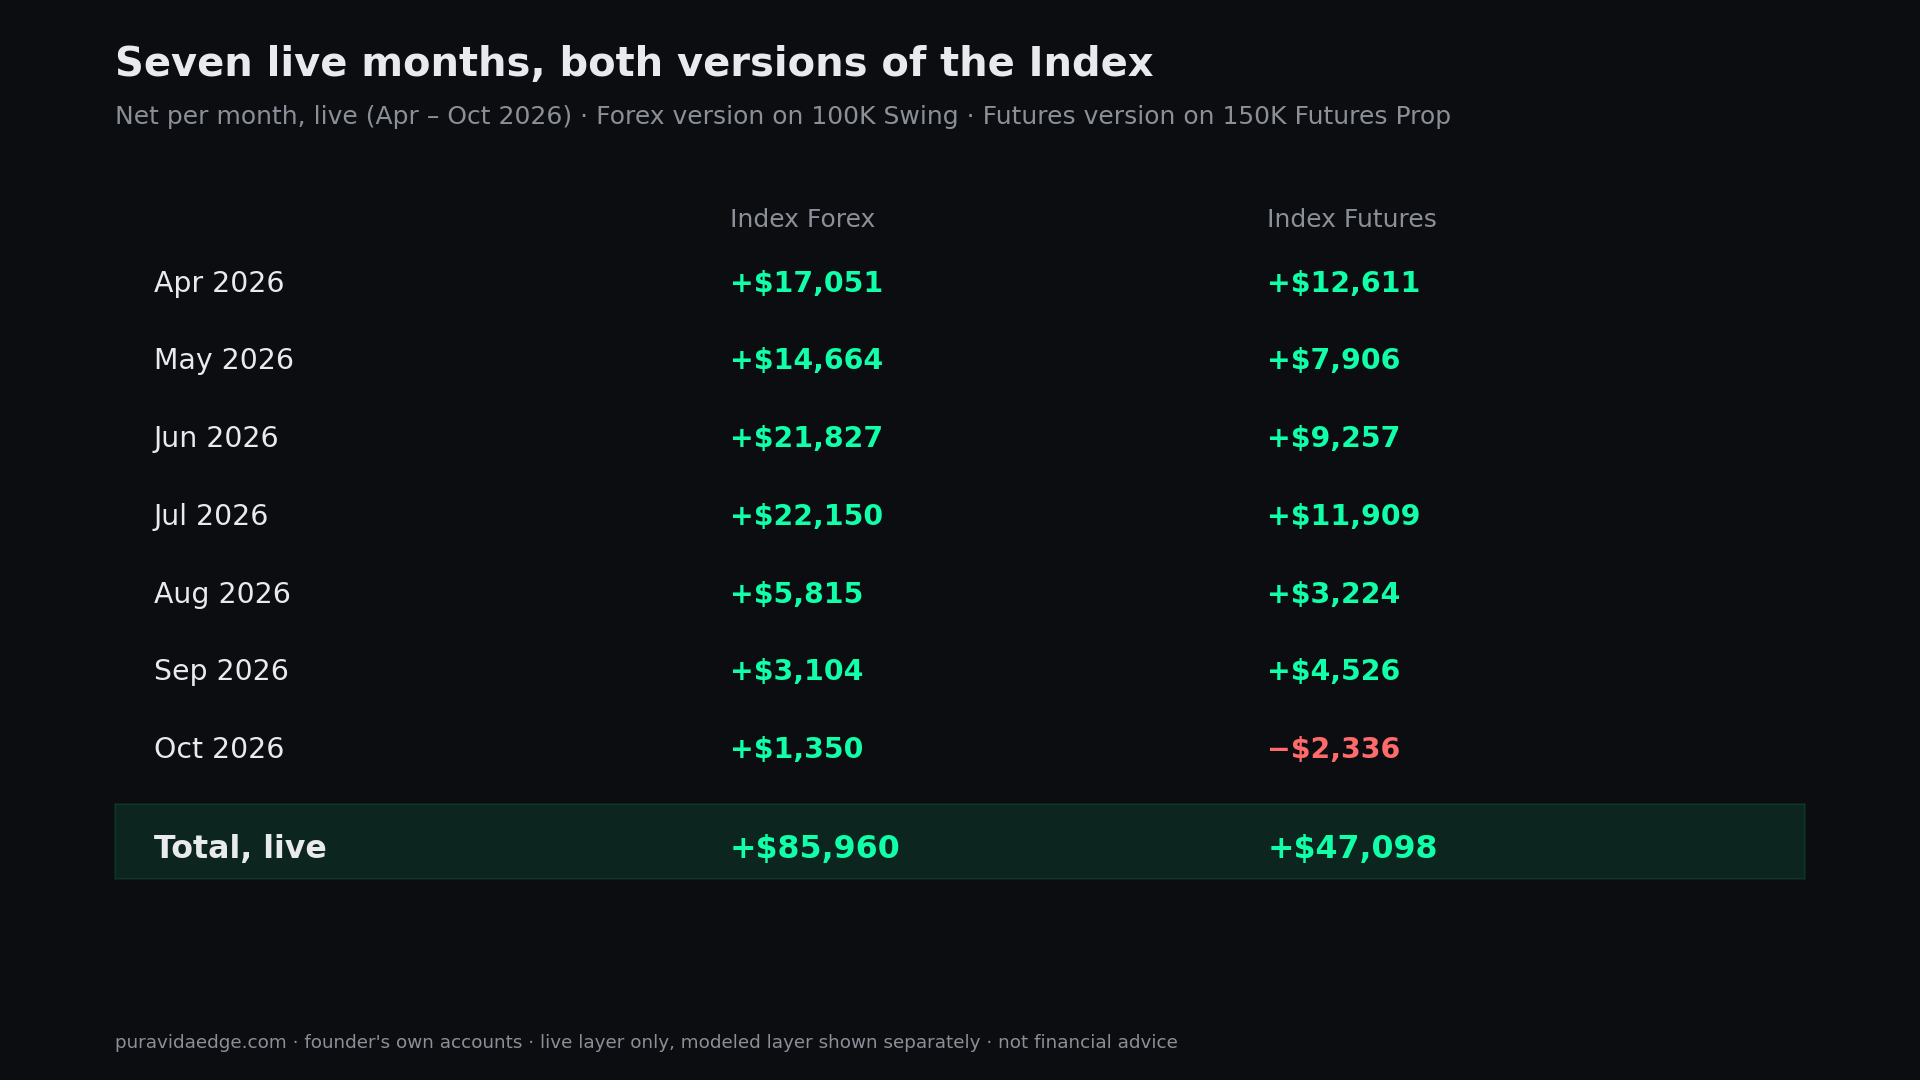
| Month (live) | Index Forex, 100K Swing | Index Futures, 150K Futures Prop |
|---|---|---|
| Apr 2026 | +$17,051 | +$12,611 |
| May 2026 | +$14,664 | +$7,906 |
| Jun 2026 | +$21,827 | +$9,257 |
| Jul 2026 | +$22,150 | +$11,909 |
| Aug 2026 | +$5,815 | +$3,224 |
| Sep 2026 | +$3,104 | +$4,526 |
| Oct 2026 | +$1,350 | −$2,336 |
| Live total, Apr – Oct 2026 | +$85,960 | +$47,098 |
Seven green months on the Forex version. Six of seven on the Futures version, with October the first red month. The second half of the period is visibly quieter than the first, and we would rather show that than cut the table at July.
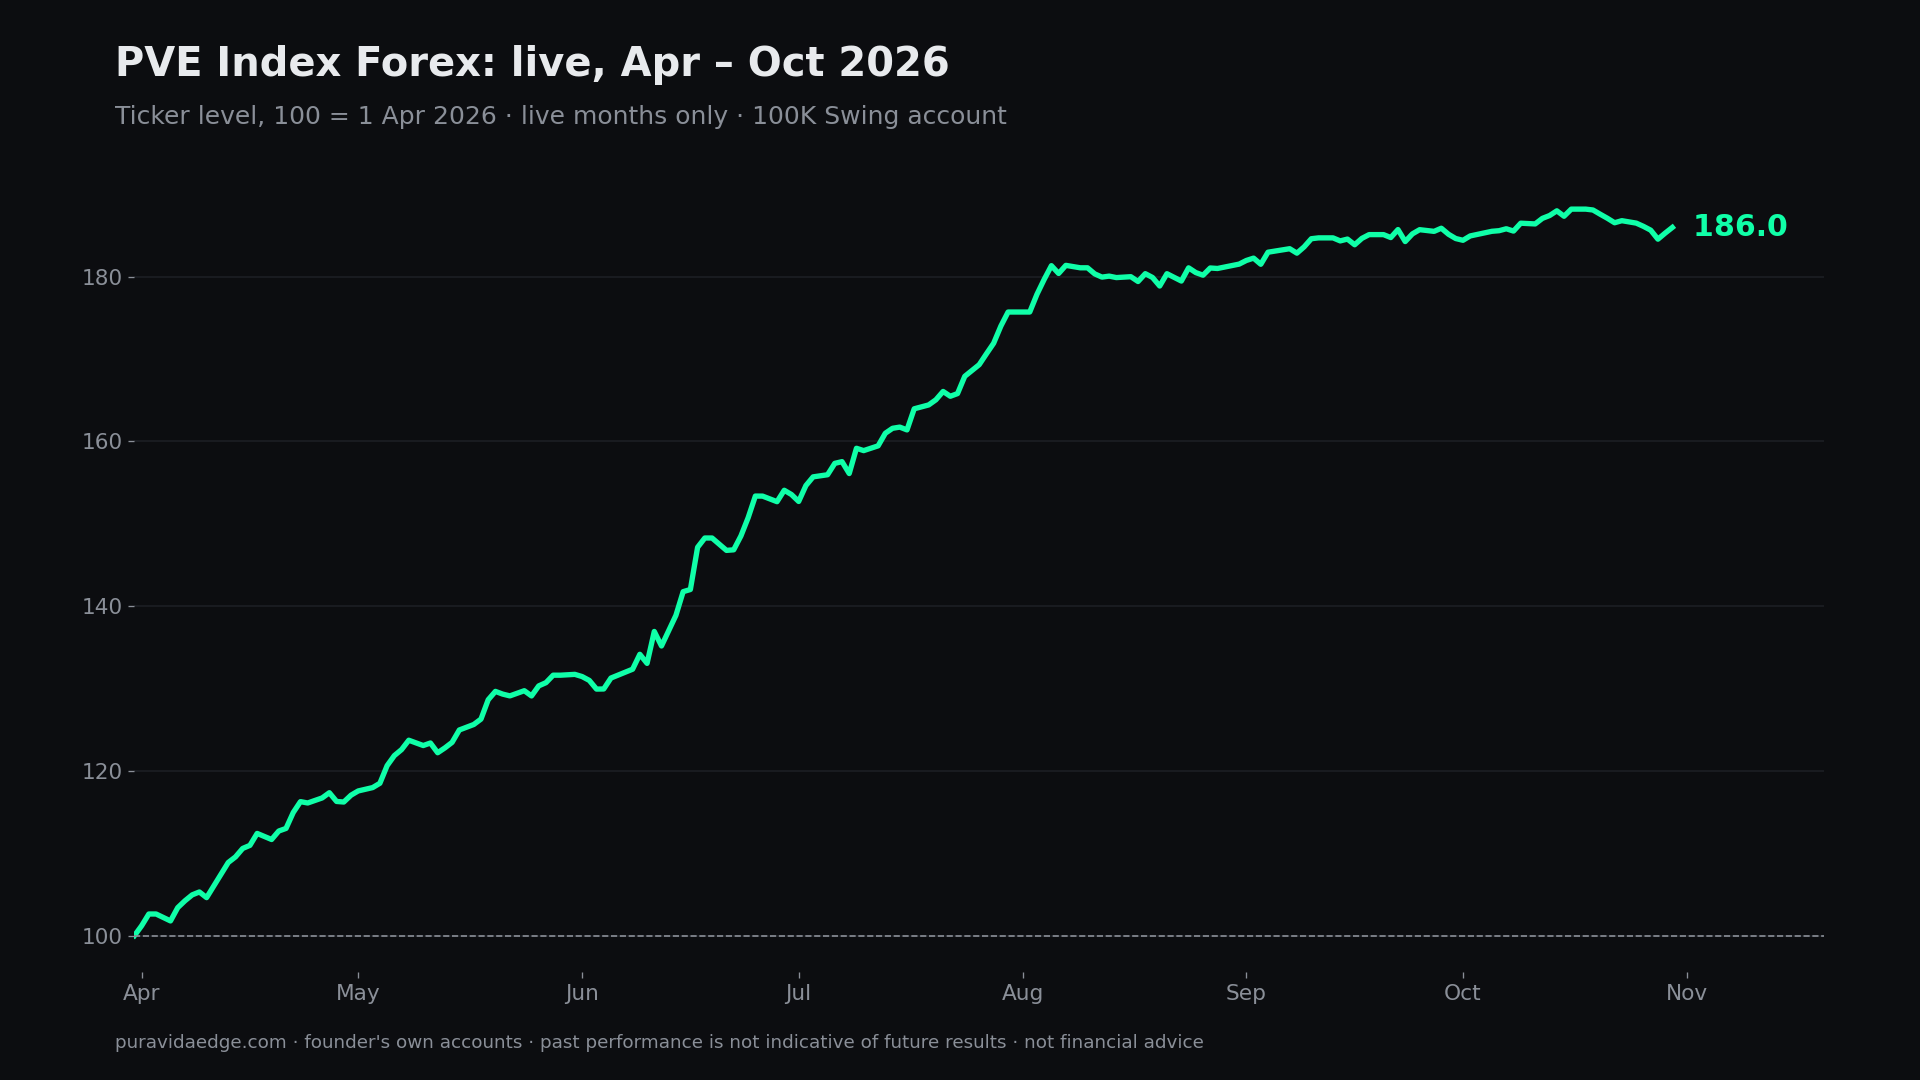
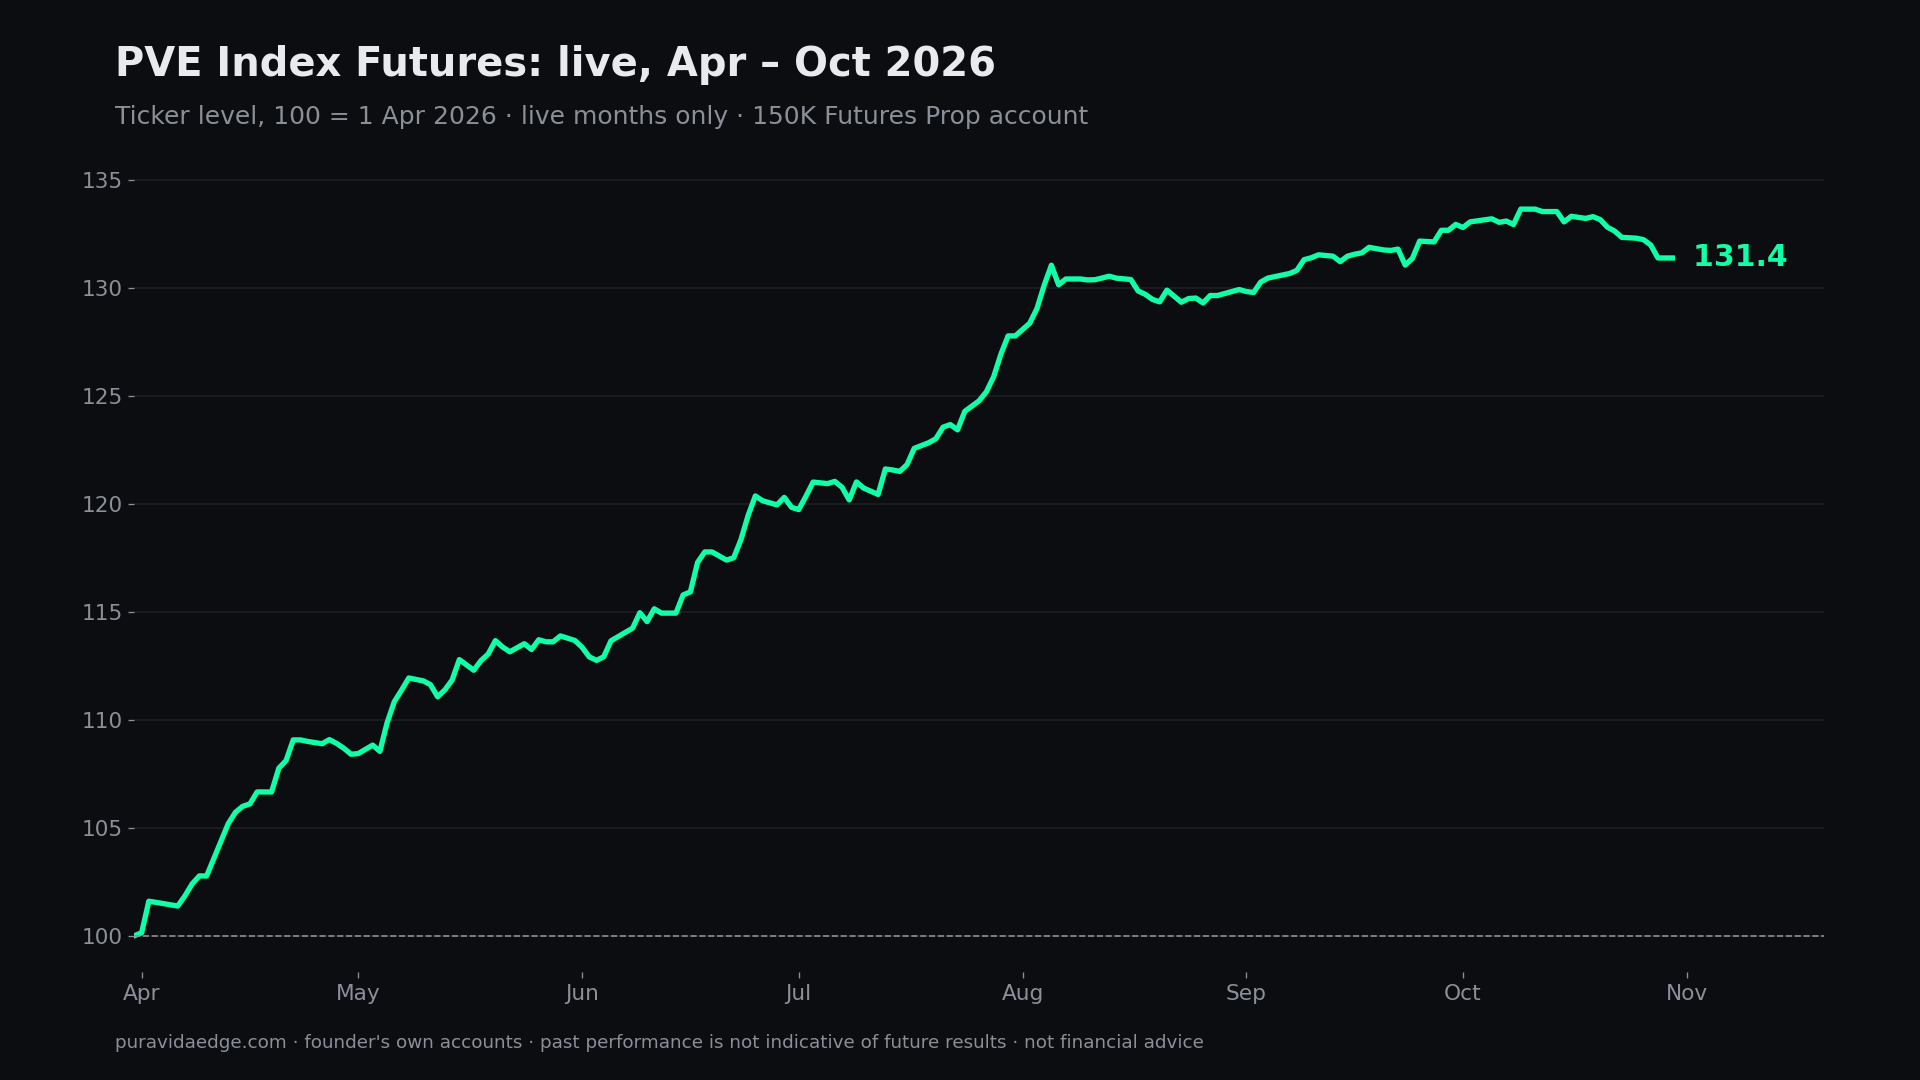
The ticker on the Index page reads 100 on 1 April 2025 and counts every dollar from the account size, the way a prop account does: profits are paid out, the account returns to nominal. Over the live months alone the Forex version moved from 100 to about 186 on that scale, the Futures version from 100 to about 131.
The modeled year, on its own line
The Index was sized and tuned on the modeled year, April 2025 to March 2026. That layer is frozen and it never moves.
| Layer | Period | Index Forex, 100K Swing | Index Futures, 150K Futures Prop |
|---|---|---|---|
| Modeled | Apr 2025 – Mar 2026 | +$100,915 | +$73,733 |
| Live | Apr 2026 – Oct 2026 | +$85,960 | +$47,098 |
| Total | Apr 2025 – Oct 2026 | +$186,876 | +$120,831 |
We keep the two layers apart on purpose. Live is not a subset of total, and total is only ever the sum of the two layers for one account. If you want to read the pace of the live months against the modeled ones, that comparison is on the modeled vs live page, strategy by strategy.
The worst days, against the limit
Results without the risk layer are half a record. The live worst days of both baskets, next to the number that would have ended the account:
| Index Forex | Index Futures | |
|---|---|---|
| Worst live day | −$1,760 | −$1,358 |
| Limit that ends the account | $5,000 daily loss limit | $4,500 trailing buffer |
| Max end-of-day drawdown, live | $3,649 | $3,396 |
| Live trades across all tracks | 1,130 (both versions, Apr – Oct 2026) |
Those are basket numbers: 18 tracks in each version, measured together. One strategy having a bad day inside the basket is not the basket having a bad day.
What was inside the basket
Both versions were rebalanced on 31 October 2026 with the Squeeze family added (NAS and XAU in the Forex version, MNQ and MGC in the Futures version), 18 tracks each, history recalculated. The October contribution table on the Index page shows which tracks moved the month:
- Forex version, October: 8 tracks positive, 7 negative, 3 flat. Top three: Squeeze NAS +$1,259, Fade XAU +$1,013, Trace NAS +$780.
- Futures version, October: 3 tracks positive, 9 negative, 6 flat. Top three: Squeeze MNQ +$973, Fade MGC +$328, Reject MGC +$295.
October was a hard month for the Futures basket. The point of holding 18 tracks is that a month like that costs $2,336 on a 150K account, not the account.
The forecast, on its own line
Monte Carlo, 1,500 paths, 3-year horizon, input Apr 2025 – Oct 2026:
| Index Forex | Index Futures | |
|---|---|---|
| Blow rate per year | 0.00% | 0.02% |
| Median net per year | $80,873 | $52,381 |
| Median payout units per year | 44.7 | 38.7 |
A forecast is a distribution, not a result, and it sits on its own line for that reason.
How to read seven months
Seven months is enough to see the basket behave: it was green through the quarter it was built for, it slowed through the summer, and it took a red month on the Futures side in October without touching the buffer. It is not enough to call a long-term return, and we don't. The record grows by one closed month every month, both versions, every layer labeled, on the Index page.
Same numbers, every month, in your inbox.
The Playbook keeps the catalogue in one place, modeled and live separately, refreshed with each monthly update. One PDF, then our letters with what the systems did.
By email, from Puerto Viejo, Costa Rica. Unsubscribe anytime.
FAQ
Why does the Forex version earn more? Different account, different instruments, different sizing. The Forex version runs on a 100K Swing account with a static drawdown; the Futures version on a 150K Futures Prop account with a trailing floor and no hedging, which fits a tighter basket. Fewer strategies, more per dollar of drawdown covers that.
Are these numbers from your own accounts? Yes. Founder's own prop accounts, every trade from the same alerts customers receive. The closed trades are on the Signals page.
Is October included in a quarter? It is shown as Q4 2026 to date. The quarter is closed on 31 December.
What changed with the rebalance? Squeeze was added to both versions, weights as of 31 October 2026, and the history was recalculated on the new composition. The composition note is on the Index page.
Can I run one version on my own account? Both versions are available as portfolios inside the plans; the preset for your account size is in the setup guide.
Founder's own accounts. Live (since Apr 2026), modeled (Apr 2025 – Mar 2026) and forecast (Monte Carlo, 1,500 paths) layers are labeled separately. Past performance does not guarantee future results. Not financial advice.