Nineteen payout units a year: the forecast for all fifteen portfolios
Across the fifteen portfolios in the catalog, the forecast gives an average of 19 payout units a year. This post explains what that unit is, lists the number for every portfolio, shows which account size reaches its first unit fastest, and says plainly what the number does not promise.
What a payout unit is
A payout unit is the amount of profit a prop firm lets you withdraw in one request on that account. We model it as the account's payout threshold at the preset the portfolio runs on. One unit means the account has produced enough profit for one withdrawal; nineteen units a year means the forecast expects enough profit for nineteen withdrawals, if the firm's calendar allowed them one after another.
The unit is a measure of how fast profit stacks. It is not a withdrawal date, because the date is decided by the firm's cycle, the minimum trading days and the consistency rule. That distinction is the subject of a payout unit in 24 days is a median, not a date.
The fifteen portfolios
Forecast layer: Monte Carlo, 1,500 paths, 3-year horizon, input Apr 2025 – Oct 2026. Median units per year and median days to the first unit, at each portfolio's catalog preset.
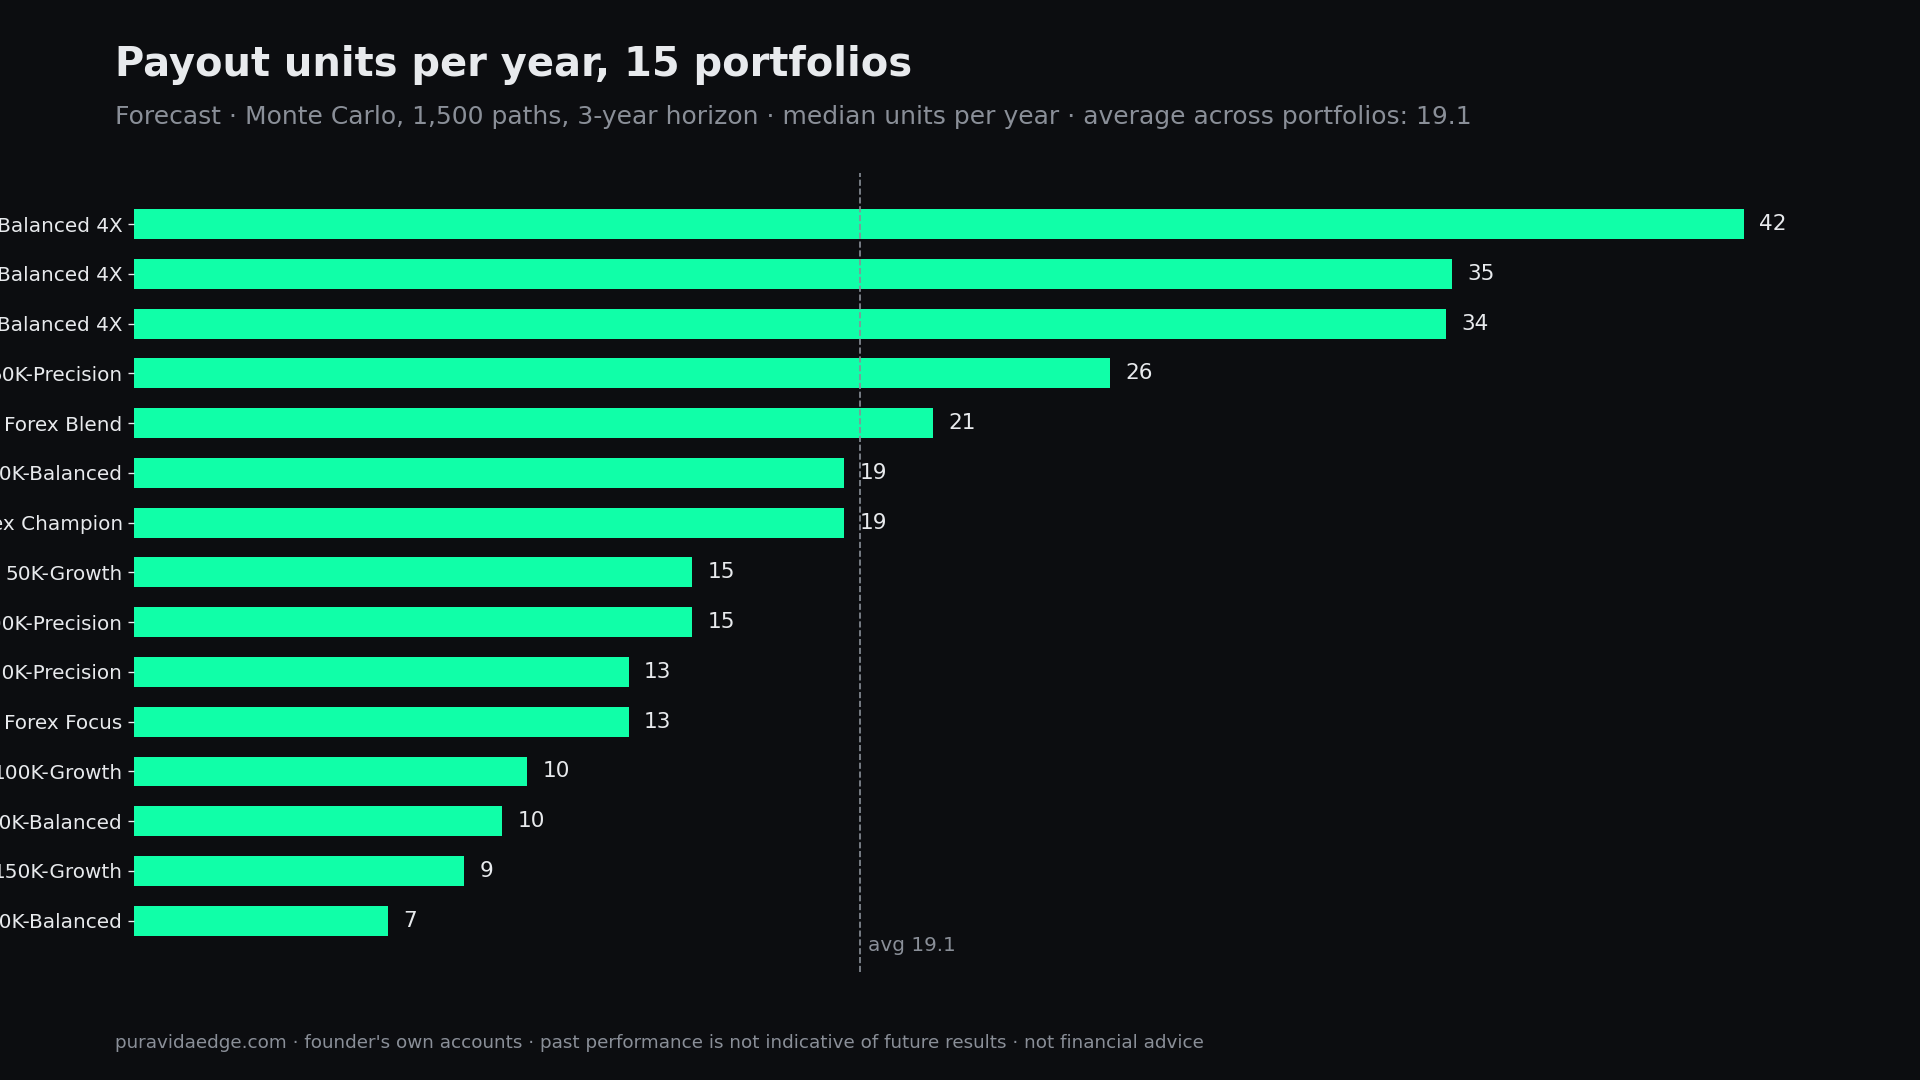
| Portfolio | Account | Units per year (median) | Days to first unit (median) | Blow rate per year |
|---|---|---|---|---|
| 50K-Balanced 4X | 50K Futures | 42 | 33 | 2.62% |
| 100K-Balanced 4X | 100K Futures | 35 | 39 | 2.76% |
| 150K-Balanced 4X | 150K Futures | 35 | 39 | 2.67% |
| 50K-Precision | 50K Futures | 26 | 57 | 3.38% |
| Forex Blend | 100K Swing | 21 | 51 | 0.04% |
| 50K-Balanced | 50K Futures | 19 | 65 | 1.58% |
| Forex Champion | 100K Swing | 19 | 57 | 0.02% |
| 50K-Growth | 50K Futures | 15 | 83 | 1.93% |
| 100K-Precision | 100K Futures | 15 | 90 | 4.66% |
| 150K-Precision | 150K Futures | 13 | 103 | 3.67% |
| Forex Focus | 100K Swing | 13 | 84 | 0.02% |
| 100K-Growth | 100K Futures | 10 | 119 | 0.81% |
| 150K-Balanced | 150K Futures | 10 | 126 | 1.15% |
| 150K-Growth | 150K Futures | 9 | 149 | 0.22% |
| 100K-Balanced | 100K Futures | 7 | 199 | 0.00% |
| Average, 15 portfolios | 19.1 |
For comparison, the two versions of the PVE Index sit above the whole table: Index Forex 45 units a year on a 100K Swing account, Index Futures 39 on a 150K Futures Prop account, with blow rates of 0.00% and 0.02%. Eighteen tracks each; that is what a full basket buys in payout pace.
What decides the pace
Three things, in order.
Account size against the threshold. A 50K account has a small payout threshold relative to the portfolio's daily moves, so the same strategies cross it more often. That is why the 50K-Balanced 4X leads the table and the 150K-Growth sits near the bottom with the same families inside.
How much of the floor the basket uses. Precision portfolios are sized closer to the floor and pay faster, with higher blow rates. Balanced and Growth are sized further from it and pay slower, with lower blow rates. The two columns move against each other on purpose; read them together.
What happens to the buffer after the first payout. On a trailing floor the first withdrawal narrows the buffer, which is why the Futures portfolios cluster on a different curve than the Forex Swing ones. That mechanism is in what happens to your drawdown buffer after the first payout.
The live check
The forecast is a distribution. The live layer is what actually happened, and for the baskets we run ourselves it is public: on the Index Forex (100K Swing), April to October 2026, the worst live day was −$1,760 against a $5,000 daily limit; on the Index Futures (150K Futures Prop) −$1,358 against a $4,500 trailing buffer. The live monthly record for both is in Seven months live.
What nineteen does not promise
- It does not promise nineteen withdrawals. Firms cap requests per cycle, require minimum trading days and apply consistency rules. The unit counts profit, the firm counts calendar.
- It is a median. Half the forecast paths produce more, half produce less, and the spread per portfolio is on each portfolio page.
- It is not a return. A payout unit on a 50K account and one on a 150K account are different dollar amounts.
- It comes with a blow rate in the next column. A portfolio that pays 26 units a year at 3.38% blow is a different proposition from one that pays 7 at 0.00%.
Same numbers, every month, in your inbox.
The Playbook keeps the catalogue in one place, modeled and live separately, refreshed with each monthly update. One PDF, then our letters with what the systems did.
By email, from Puerto Viejo, Costa Rica. Unsubscribe anytime.
FAQ
Which portfolio pays first? At the catalog presets, 50K-Balanced 4X: median 33 days to the first unit. Which prop account pays first walks through all fifteen.
Why is 100K-Balanced the slowest? Lowest blow rate in the table (0.00%) and the composition changed on 1 October (Anchor MNQ 4 + Trace MGC 1). It is sized furthest from the floor, so it reaches the threshold rarely and loses the account almost never.
Can I combine portfolios? The Index is the combined basket: every catalog track in one composition per account type, with the payout pace shown above.
Is the forecast updated? Every month, with the live months added to the input. Numbers here are as of 30 October 2026.
Founder's own accounts. Forecast (Monte Carlo, 1,500 paths, 3-year horizon, input Apr 2025 – Oct 2026) and live (since Apr 2026) layers are labeled separately. Past performance does not guarantee future results. Not financial advice.